
ETF Tracker StatSheet
https://theetfbully.com/2017/04/weekly-statsheet-etf-tracker-newsletter-updated-04202017/
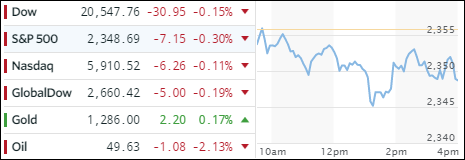
EQUITIES UP FOR THE WEEK BUT SLIPPING BEFORE THE FRENCH ELECTIONS
- Moving the Markets
Cautiousness prevailed prior to the closely contested 1st round of the French elections this weekend with equities pulling back but showing green numbers for the week as the S&P 500 gained +0.86%.
ZH summed the past 5 trading days up nicely by observing:
- Transportation sector best week in 4 months
- Small Caps best week in 4 months
- Nasdaq best week in 2 months
- S&P 500 best week in 2 months
- Dow best week in 7 weeks
On the other hand, bad news, like the biggest drop in US Macro Data in 6 years, was simply ignored and not reported by MSM. News from Trump at mid-day about his “greatest tax cut ever” caused a quick rebound, which was pretty much erased by day’s end.
The yield on the 10-year Treasury remained unchanged from yesterday but ended lower for the week. The dollar index inched higher but remains below its psychologically important 100 level. Gold gained a tad after being slammed 3 times this week but is still attempting to break through its 1,300 glass ceiling.
All eyes are on the French elections, the outcome of which can be “market moving” even though it’s only round one of two, with number two being on deck in 2 weeks.
- ETFs in the Spotlight (updated for 2017)
In case you missed the announcement and description of this section, you can read it here again.
It features 10 broadly diversified and sector ETFs from my HighVolume list as posted every Saturday. Furthermore, they are screened for the lowest MaxDD% number meaning they have been showing better resistance to temporary sell offs than all others over the past year.
The below table simply demonstrates the magnitude with which some of the ETFs are fluctuating in regards to their positions above or below their respective individual trend lines (%M/A). A break below, represented by a negative number, shows weakness, while a break above, represented by a positive percentage, shows strength.
For hundreds of ETF choices, be sure to reference Thursday’s StatSheet.
Year to date, here’s how the 2017 candidates have fared so far:
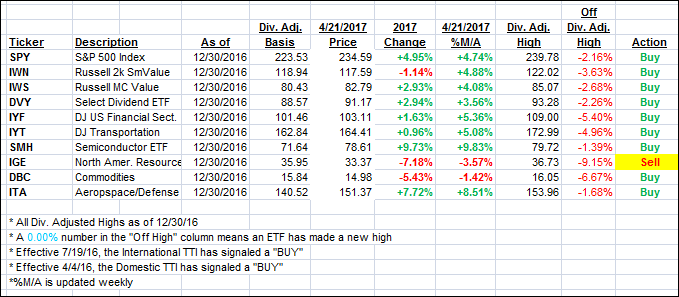
Again, the %M/A column above shows the position of the various ETFs in relation to their respective long term trend lines, while the trailing sell stops are being tracked in the “Off High” column. The “Action” column will signal a “Sell” once the -7.5% point has been taken out in the “Off High” column.
- Trend Tracking Indexes (TTIs)
Our Trend Tracking Indexes (TTIs) slipped as uncertainty ahead of the French elections pulled the markets down.
Here’s how we closed 4/21/2017:
Domestic TTI: +2.46% (last close +2.63%)—Buy signal effective 4/4/2016
International TTI: +4.68% (last close +4.94%)—Buy signal effective 7/19/2016
Disclosure: I am obliged to inform you that I, as well as my advisory clients, own some of the ETFs listed in the above table. Furthermore, they do not represent a specific investment recommendation for you, they merely show which ETFs from the universe I track are falling within the guidelines specified.
————————————————————-
READER Q & A FOR THE WEEK
All Reader Q & A’s are listed at our web site!
Check it out at:
https://theetfbully.com/questions-answers/
———————————————————-
WOULD YOU LIKE TO HAVE YOUR INVESTMENTS PROFESSIONALLY MANAGED?
Do you have the time to follow our investment plans yourself? If you are a busy professional who would like to have his portfolio managed using our methodology, please contact me directly or get more details at:
https://theetfbully.com/personal-investment-management/
———————————————————
Back issues of the ETF/No Load Fund Tracker are available on the web at:
https://theetfbully.com/newsletter-archives/
Contact Ulli