
- Moving the Markets
An early rally attempt driven by Apple reaching new all-time highs was rebuffed in a hurry, as worries surfaced that Trump may not be able to deliver on his promised tax cuts as quickly as had been assumed, an assumption that has been the reckless driver of the market in recent months.
Right now, it appears that nervousness is increasing ahead of the crucial vote on Thursday regarding the new healthcare plan. Depending on the news source, it’s become more questionable today as to whether Trump can muster enough votes to push the new legislation through. If he fails, his much hailed tax cuts may have to be put on the back burner and may not come to fruition until next year.
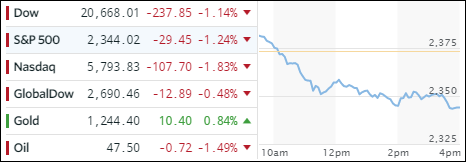
With Wall Street having more or less counted on tax cuts and the infrastructure plan, any disappointment will impact market direction, the beginning of which we may have witnessed today. The major indexes had their first 1% plus drop since October 11, as the D.C. drama intensified.
Not helping matters was the continued demise of the US currency with the dollar index dropping back below the widely watched 100 level and to near election lows. Bank stocks (JPM, GS, MS, BAC) got clobbered again and had their worst day since Brexit. The winner again was precious metals, which continued on their recent upward path. Is there more downside to come? The following graph attempts to shed some light on that question:
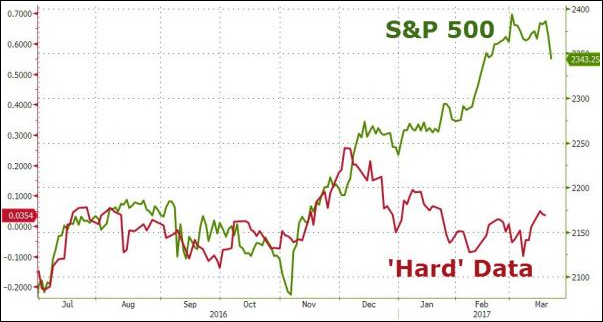
Chart courtesy of ZeroHedge
- ETFs in the Spotlight (updated for 2017)
In case you missed the announcement and description of this section, you can read it here again.
It features 10 broadly diversified and sector ETFs from my HighVolume list as posted every Saturday. Furthermore, they are screened for the lowest MaxDD% number meaning they have been showing better resistance to temporary sell offs than all others over the past year.
The below table simply demonstrates the magnitude with which some of the ETFs are fluctuating in regards to their positions above or below their respective individual trend lines (%M/A). A break below, represented by a negative number, shows weakness, while a break above, represented by a positive percentage, shows strength.
For hundreds of ETF choices, be sure to reference Thursday’s StatSheet.
Year to date, here’s how the 2017 candidates have fared so far:
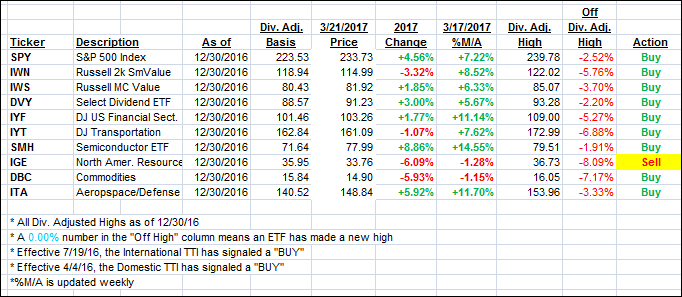
Again, the %M/A column above shows the position of the various ETFs in relation to their respective long term trend lines, while the trailing sell stops are being tracked in the “Off High” column. The “Action” column will signal a “Sell” once the -7.5% point has been taken out in the “Off High” column.
- Trend Tracking Indexes (TTIs)
Our Trend Tracking Indexes (TTIs) came off their highs as the major indexes managed to slip more than 1%.
Here’s how we closed 3/21/2017:
Domestic TTI: +2.27% (last close +2.84%)—Buy signal effective 4/4/2016
International TTI: +5.54% (last close +6.18%)—Buy signal effective 7/19/2016
Disclosure: I am obliged to inform you that I, as well as my advisory clients, own some of the ETFs listed in the above table. Furthermore, they do not represent a specific investment recommendation for you, they merely show which ETFs from the universe I track are falling within the guidelines specified.
Contact Ulli