
ETF Tracker StatSheet
Market Commentary
S&P 500 Logs In Longest Win Streak In 2 Years
- Moving the Markets
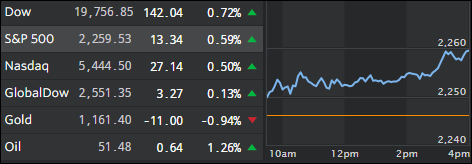
Right now we appear to be on a one-way street as far as the stock market is concerned with the S&P 500 recording its longest win streak since June 2014 while the Dow notched its fifth week of gains.
It appears that Wall Street can’t get enough of the Trump campaign promises of lower taxes, reduced regulations and increased infrastructure investments that are bound to hopefully lead to a new life of economic growth.
Sure, the market surge looks overdone, especially when considering that none of the underlying problems of reckless government spending and ever increasing debt, just to name a couple, are not even being addressed let alone being resolved. Right now, the trend remains our friend, no matter what the underlying fundamentals say, and we will remain on board until our directional indicators give the sign to exit.
- ETFs in the Spotlight
In case you missed the announcement and description of this section, you can read it here again.
It features 10 broadly diversified ETFs from my HighVolume list as posted every Monday. Furthermore, they are screened for the lowest MaxDD% number meaning they have been showing better resistance to temporary sell offs than all others over the past year.
Here are the 10 candidates:
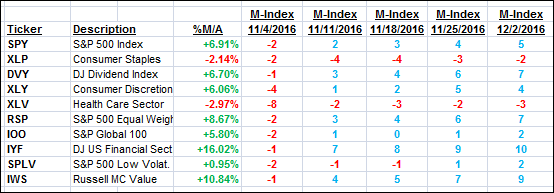
The above table simply demonstrates the magnitude with which some of the ETFs are fluctuating in regards to their positions above or below their respective individual trend lines (%M/A). A break below, represented by a negative number, shows weakness, while a break above, represented by a positive percentage, shows strength.
For hundreds of ETF choices, be sure to reference Thursday’s StatSheet.
Year to date, here’s how the above candidates have fared so far:
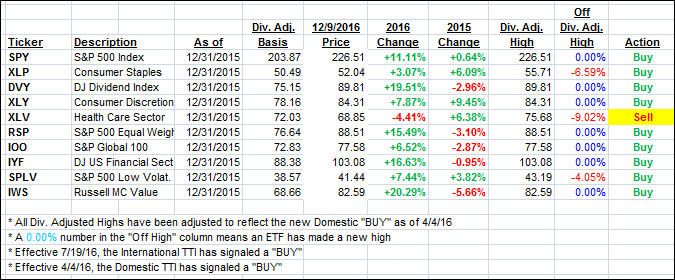
Again, the first table above shows the position of the various ETFs in relation to their respective long term trend lines (%M/A), while the second one tracks their trailing sell stops in the “Off High” column. The “Action” column will signal a “Sell” once the -7.5% point has been taken out in the “Off High” column.
- Trend Tracking Indexes (TTIs)
What a difference a week makes. Our Trend Tracking Indexes (TTIs) picked up speed as the major indexes continued to storm into record territory.
Here’s how we closed 12/9/2016:
Domestic TTI: +1.57% (last Friday +0.34%)—Buy signal effective 4/4/2016
International TTI: +3.50% (last Friday +1.48%)—Buy signal effective 7/19/2016
Have a great weekend.
Ulli…
Disclosure: I am obliged to inform you that I, as well as my advisory clients, own some of the ETFs listed in the above table. Furthermore, they do not represent a specific investment recommendation for you, they merely show which ETFs from the universe I track are falling within the guidelines specified.
————————————————————-
READER Q & A FOR THE WEEK
All Reader Q & A’s are listed at our web site!
Check it out at:
https://theetfbully.com/questions-answers/
———————————————————-
WOULD YOU LIKE TO HAVE YOUR INVESTMENTS PROFESSIONALLY MANAGED?
Do you have the time to follow our investment plans yourself? If you are a busy professional who would like to have his portfolio managed using our methodology, please contact me directly or get more details at:
https://theetfbully.com/personal-investment-management/
———————————————————
Back issues of the ETF/No Load Fund Tracker are available on the web at:
https://theetfbully.com/newsletter-archives/
Contact Ulli