
1. Moving the Markets
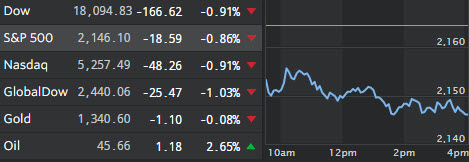
While a general unease about tonight’s debate kept the major indexes in negative territory all day, other bad news contributed to the weakness as well. New home sales tumbled with prices touching lows not see in some 2 years while the supply of homes rose to 4.6 months from 4.2 months when using the current rate of sales.
Then there was Deutsche Bank. I have repeatedly posted that either Deutsche Bank or the Italian banking system may be the “canary in the coalmine” contributing to a “re-set” in asset prices should either one implode. At least for the day, it was Deutsche’s turn to put lipstick on that pig by “managing news flow” in the most positive way possible.
Nevertheless, its stock price made an all-time low, not just down over 7% on the day but also down 16% since the middle of September, and in great jeopardy of going into single digits.
Why is that such a big deal? Mainly because Deutsche has the largest derivatives book in the world with over $50 trillion; if they run into financial difficulties every banking system in the world will be affected. Looking at a stock price comparison between Deutsche and Lehman Bothers, who ushered in the last financial crisis, you will find the similarities amazing:
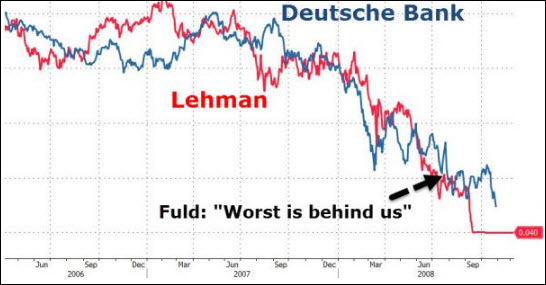
Chart courtesy of ZeroHedge
The only question in mind is “when” not “if” the price collapses to zero.
2. ETFs in the Spotlight
In case you missed the announcement and description of this section, you can read it here again.
It features 10 broadly diversified ETFs from my HighVolume list as posted every Monday. Furthermore, they are screened for the lowest MaxDD% number meaning they have been showing better resistance to temporary sell offs than all others over the past year.
Here are the 10 candidates:
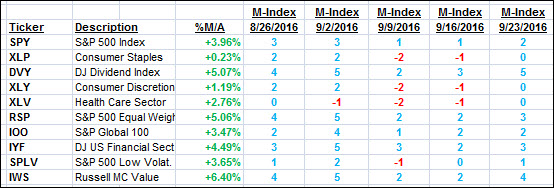
The above table simply demonstrates the magnitude with which some of the ETFs are fluctuating in regards to their positions above or below their respective individual trend lines (%M/A). A break below, represented by a negative number, shows weakness, while a break above, represented by a positive percentage, shows strength.
For hundreds of ETF choices, be sure to reference Thursday’s StatSheet.
Year to date, here’s how the above candidates have fared so far:
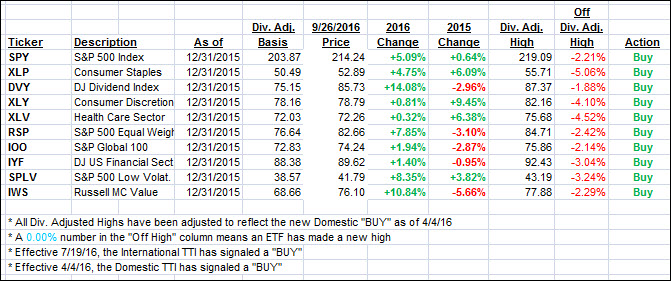
Again, the first table above shows the position of the various ETFs in relation to their respective long term trend lines (%M/A), while the second one tracks their trailing sell stops in the “Off High” column. The “Action” column will signal a “Sell” once the -7.5% point has been taken out in the “Off High” column.
3. Trend Tracking Indexes (TTIs)
Both of our Trend Tracking Indexes (TTIs) slipped as the major indexes headed lower ahead of “debate” night.
Here’s how we closed 9/26/2016:
Domestic TTI: +2.17% (last close +2.48%)—Buy signal effective 4/4/2016
International TTI: +4.20% (last close +5.12%)—Buy signal effective 7/19/2016
Disclosure: I am obliged to inform you that I, as well as my advisory clients, own some of the ETFs listed in the above table. Furthermore, they do not represent a specific investment recommendation for you, they merely show which ETFs from the universe I track are falling within the guidelines specified.
Contact Ulli