
1. Moving the Markets
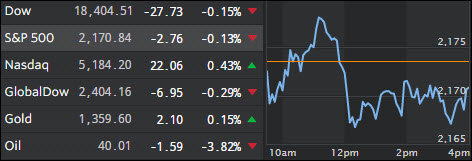
U.S. stocks were mixed Monday as a two-week period of relative stability in the markets continued despite a sharp slide in oil prices.
In Uber news, we heard today that the company is officially “bowing out” of the China market. Uber’s Chinese operations will merge with Beijing-based ride hailing firm Didi Chuxing. Didi said in a statement it would take over all of Uber China and operate it as a separate brand. In exchange, the company said, Uber will receive a stake in Didi and Uber founder Travis Kalanick will join the Chinese company’s board. The deal is set to be worth about $35 billion.
Eyes moved sharply back to oil today, as the price of West Texas Intermediate (WTI) fell slightly below $40 mid-day. On Monday, the price of WTI, the U.S. benchmark, closed 3.7% lower, to $40.06 as traders remained concerned about a surplus of global supplies. In early May, many were speculating that prices would move (and stay) above $50 a barrel for the summer months. However, signs of increasing production and reduced geopolitical disruption have sent the commodity in an opposite direction this summer in what looks like a repeat of 2015. The last time it closed below $40 a barrel was April 18, when it settled at $39.78.
Of course, the divergence between WTI and the S&P 500 has grown to more extreme levels as ZH reports here with the following chart being a true eye opener. Take a look:
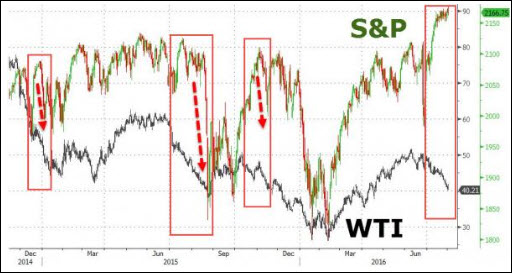
As you can see, the last 3 times we had this kind of divergence between stocks and oil, stocks ended up getting spanked.
2. ETFs in the Spotlight
In case you missed the announcement and description of this section, you can read it here again.
It features 10 broadly diversified ETFs from my HighVolume list as posted every Monday. Furthermore, they are screened for the lowest MaxDD% number meaning they have been showing better resistance to temporary sell offs than all others over the past year.
Here are the 10 candidates:
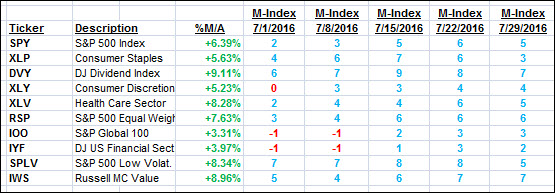
The above table simply demonstrates the magnitude with which some of the ETFs are fluctuating in regards to their positions above or below their respective individual trend lines (%M/A). A break below, represented by a negative number, shows weakness, while a break above, represented by a positive percentage, shows strength.
For hundreds of ETF/Mutual fund choices, be sure to reference Thursday’s StatSheet.
Year to date, here’s how the above candidates have fared so far:

Again, the first table above shows the position of the various ETFs in relation to their respective long term trend lines (%M/A), while the second one tracks their trailing sell stops in the “Off High” column. The “Action” column will signal a “Sell” once the -7.5% point has been taken out in the “Off High” column.
3. Trend Tracking Indexes (TTIs)
Our Domestic Trend Tracking Index (TTI) barely changed as the major indexes went sideways.
Here’s how we closed 8/1/2016:
Domestic TTI: +3.10% (last close +3.13%)—Buy signal effective 4/4/2016
International TTI: +3.31% (last close +3.50%)—Buy signal effective 7/19/2016
Disclosure: I am obliged to inform you that I, as well as advisory clients of mine, own some of these listed ETFs. Furthermore, they do not represent a specific investment recommendation for you, they merely show which ETFs from the universe I track are falling within the guidelines specified.
Contact Ulli