
1. Moving the Markets
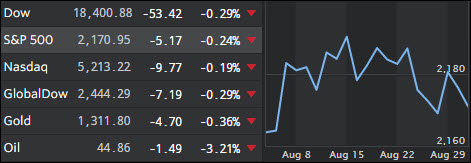
Wall Street shares dipped lower on the final trading day of August, a month that has been void of market scares, as traders look ahead to a key jobs report Friday and a Federal Reserve decision on interest rates in late September.
Both the S&P 500 and Dow ended the month basically flat, with the S&P 500 posting a fractional loss. Perhaps more importantly is that the broad market average snapped a five-month winning streak.
The market calm, however, might not continue as investors brace for what could be a market-moving September. The first big event comes Friday, when the government releases the August jobs report. If the number comes in strong, or around or above the 180,000 jobs economists’ forecast, it could boost the odds of a Fed rate hike at the central bank’s Sept. 20-21 meeting, unless the Fed simply continues its game of crying “wolf.”
As you know, the Fed has kept rates steady all year, after boosting rates off zero back in December, its first rate hike in nearly a decade. Wall Street is not prepared for a September rate hike, and is betting the first hike in 2016 won’t come until December at the earliest. If the Fed moves earlier than expected, market volatility is likely to elevate quickly.
2. ETFs in the Spotlight
In case you missed the announcement and description of this section, you can read it here again.
It features 10 broadly diversified ETFs from my HighVolume list as posted every Monday. Furthermore, they are screened for the lowest MaxDD% number meaning they have been showing better resistance to temporary sell offs than all others over the past year.
Here are the 10 candidates:
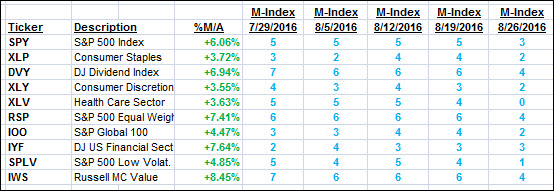
The above table simply demonstrates the magnitude with which some of the ETFs are fluctuating in regards to their positions above or below their respective individual trend lines (%M/A). A break below, represented by a negative number, shows weakness, while a break above, represented by a positive percentage, shows strength.
For hundreds of ETF choices, be sure to reference Thursday’s StatSheet.
Year to date, here’s how the above candidates have fared so far:
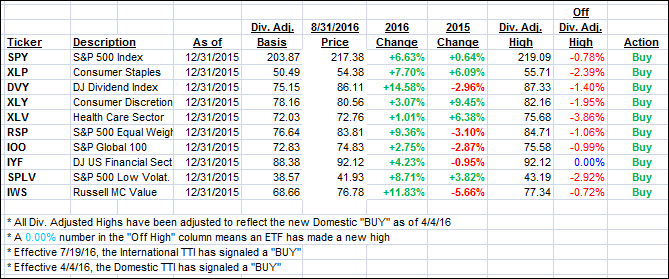
Again, the first table above shows the position of the various ETFs in relation to their respective long term trend lines (%M/A), while the second one tracks their trailing sell stops in the “Off High” column. The “Action” column will signal a “Sell” once the -7.5% point has been taken out in the “Off High” column.
3. Trend Tracking Indexes (TTIs)
Our Trend Tracking Indexes (TTIs) pulled back again as the major indexes slipped to end the month of August.
Here’s how we closed 8/31/2016:
Domestic TTI: +2.70% (last close +2.87%)—Buy signal effective 4/4/2016
International TTI: +4.32% (last close +4.41%)—Buy signal effective 7/19/2016
Disclosure: I am obliged to inform you that I, as well as my advisory clients, own some of the ETFs listed in the above table. Furthermore, they do not represent a specific investment recommendation for you, they merely show which ETFs from the universe I track are falling within the guidelines specified.
Contact Ulli