
ETF/No Load Fund Tracker StatSheet
————————————————————-
————————————————————
Market Commentary
RUNNING INTO A BRICK WALL
1. Moving the Markets
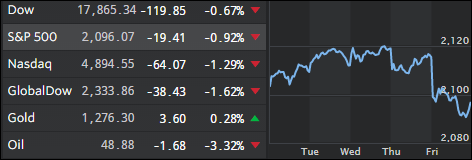
Markets were on a hot streak heading into today’s trading, driven by well-performing energy stocks and oil. However, the hopes of the S&P 500 breaking into record territory slowly faded into dust as all 3 major indexes slid into negative territory fairly quickly.
Global trading has been all about the bond market of late. The rush into bonds comes at a time when investors are worried about possible market disruptions due to political and economic uncertainties. Also pushing yields lower is the continued aggressive buying of bonds by the European Central Bank and other central bankers in an attempt to boost flagging economic growth.
Yields have been falling since last Friday’s weak May jobs report put the Federal Reserve’s interest rate hikes on hold for the time being. The next Fed meeting wraps up on Wednesday, and investors will ponder over the central bank’s announcement for clues when an interest rate hike might be coming.
Also of note today, is that U.S. crude fell 3.3% to $48.88 and back below $50 per barrel following news that the U.S. rig count rose for the second week in a row.
2. ETFs in the Spotlight
In case you missed the announcement and description of this section, you can read it here again.
It features 10 broadly diversified ETFs from my HighVolume list as posted every Monday. Furthermore, they are screened for the lowest MaxDD% number meaning they have been showing better resistance to temporary sell offs than all others over the past year.
Here are the 10 candidates:
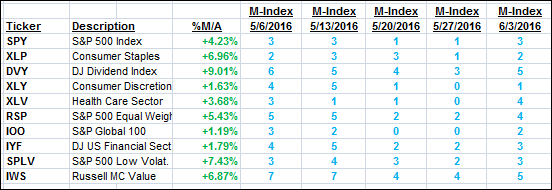
The above table simply demonstrates the magnitude with which some of the ETFs are fluctuating in regards to their positions above or below their respective individual trend lines (%M/A). A break below, represented by a negative number, shows weakness, while a break above, represented by a positive percentage, shows strength.
For hundreds of ETF/Mutual fund choices, be sure to reference Thursday’s StatSheet.
Year to date, here’s how the above candidates have fared so far:
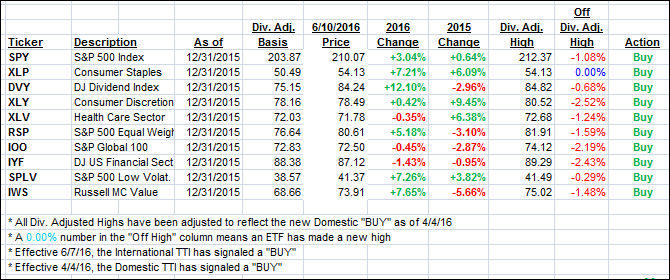
Again, the first table above shows the position of the various ETFs in relation to their respective long term trend lines (%M/A), while the second one tracks their trailing sell stops in the “Off High” column. The “Action” column will signal a “Sell” once the -7.5% point has been taken out in the “Off High” column.
3. Trend Tracking Indexes (TTIs)
Our Domestic Trend Tracking Index (TTI) stayed fairly even during past week while the International one took but remains on the bullish side of its trend line for the time being.
Volatility definitely has picked up over the past 2 days in part due to increased anxiety of the Brexit (the British leaving the EU), which will be voted on later this month.
Here’s how we closed this week:
Domestic TTI: +1.93% (last Friday +2.09%)—Buy signal effective 4/4/2016
International TTI: +0.30% (last Friday +1.45%)—Buy signal effective 6/7/2016
Have a great weekend.
Ulli…
Disclosure: I am obliged to inform you that I, as well as advisory clients of mine, own some of these listed ETFs. Furthermore, they do not represent a specific investment recommendation for you, they merely show which ETFs from the universe I track are falling within the guidelines specified.
————————————————————-
READER Q & A FOR THE WEEK
Kirk: Hi Ulli: Every time you post that S&P chart below, I get nervous:
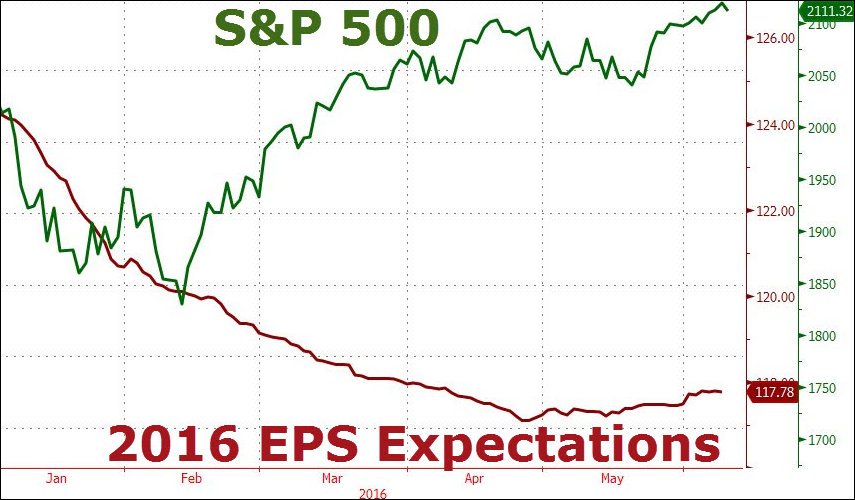
It seems so obvious that markets will have to fall drastically that I wonder if you considered skipping the buy signal? I also wonder if someone like me, who might miss a big one/two day drop, should get out now.
P.S.: I entered the ETF market with your last buy signal. Thanks for all your data sharing, etc.!
Ulli: Kirk, the reason for me posting these S&P charts is to make readers aware not only of the importance of where the market hovers relative to underlying fundamentals, but to emphasize the absolute necessity of having and executing a trailing sell stop to protect our assets whenever the inevitable correction occurs.
No, I don’t engage in guesswork by attempting to cherry-pick only certain Buy cycles. It defeats the purpose of using a disciplined investment approach, so you have to take the good with the bad, because nobody can tell me with any certainty as to which Buy cycle will be profitable and which one will not be.
Having said that I also believe that the most important component of investing in anything is the investor’s comfort level. If you are nervous about the index levels and lose sleep because of your exposure, you might consider getting out and into cash no matter what my Trend Tracking Indexes say. There is no sense in following any strategy if you are not at ease with it.
All Reader Q & A’s are listed at our web site!
Check it out at:
https://theetfbully.com/questions-answers/
———————————————————-
WOULD YOU LIKE TO HAVE YOUR INVESTMENTS PROFESSIONALLY MANAGED?
Do you have the time to follow our investment plans yourself? If you are a busy professional who would like to have his portfolio managed using our methodology, please contact me directly or get more details at:
https://theetfbully.com/personal-investment-management/
———————————————————
Back issues of the ETF/No Load Fund Tracker are available on the web at:
https://theetfbully.com/newsletter-archives/
Contact Ulli