
1. Moving the Markets
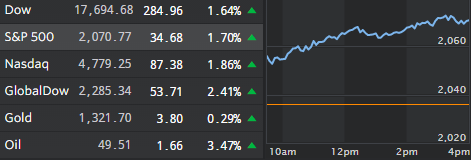
It is becoming more apparent that Brexit was perhaps just another short-term shock on the market last Friday, at least for the time being. All three major indexes have since posted solid gains, including today. The Dow has risen 554 points since Monday, which is its best back-to-back point climb since August 2015.
The level of fear and investor risk aversion is abating abroad as well, indicated by another day of strong gains for stocks in London and Europe, as well as a second day of solid gains for the British pound. Thus, most analysts are sensing that losses brought on by the Brexit will be largely manageable. Domestically, we are seeing again that poor economic data such as the worst home sales report in 6 years is being ignored, as the HFT algos have shifted into bullish mode no matter what.
The Priceline Group (PCLN) was back in the news today. CEO and founder Jay Walker announced he is launching a new travel site for business travelers. The site is called ‘Upside’ and it will issue gift cards worth upwards of $200 to travelers for their favorite stores in exchange for flexibility on airlines and hotel stays. Jay Walker has created three companies with 50 million customers each in the last several years, thus investors are bullish that he will succeed once again. The stock gained 2.92% to close at $1,239.41 a share.
2. ETFs in the Spotlight
In case you missed the announcement and description of this section, you can read it here again.
It features 10 broadly diversified ETFs from my HighVolume list as posted every Monday. Furthermore, they are screened for the lowest MaxDD% number meaning they have been showing better resistance to temporary sell offs than all others over the past year.
Here are the 10 candidates:
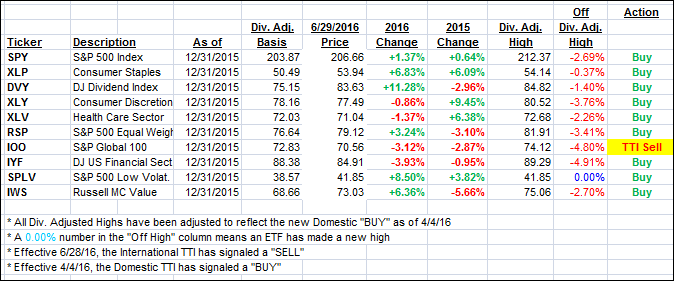
The above table simply demonstrates the magnitude with which some of the ETFs are fluctuating in regards to their positions above or below their respective individual trend lines (%M/A). A break below, represented by a negative number, shows weakness, while a break above, represented by a positive percentage, shows strength.
For hundreds of ETF/Mutual fund choices, be sure to reference Thursday’s StatSheet.
Year to date, here’s how the above candidates have fared so far:

Again, the first table above shows the position of the various ETFs in relation to their respective long term trend lines (%M/A), while the second one tracks their trailing sell stops in the “Off High” column. The “Action” column will signal a “Sell” once the -7.5% point has been taken out in the “Off High” column.
3. Trend Tracking Indexes (TTIs)
Our Domestic Trend Tracking Index (TTI) moved higher for the second day in the row as the Brexit fears were brushed aside and the markets continued to move north staging a V-type recovery. We’ve added some utilities today, and I will look to increase our equity exposure by a limited amount.
Here’s how we closed:
Domestic TTI: +1.35% (last close +0.76%)—Buy signal effective 4/4/2016
International TTI: -2.07% (last close -3.97%)—Sell signal effective 6/28/2016
Disclosure: I am obliged to inform you that I, as well as advisory clients of mine, own some of these listed ETFs. Furthermore, they do not represent a specific investment recommendation for you, they merely show which ETFs from the universe I track are falling within the guidelines specified.
Contact Ulli