
1. Moving the Markets
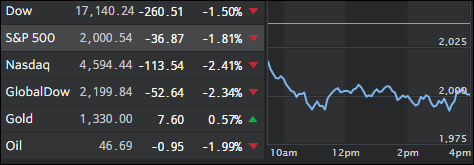
Following the Brexit vote late last week, markets did not boomerang back into positive territory today as some had hoped. In fact, all 3 major indexes here in the U.S. dropped at least 1.5%. What I can tell from today’s trading session, is that the path forward for stocks will continue to be rocky for some time while the political uncertainty in the U.K. and E.U. drags on.
Things looked pretty dicey this morning when the S&P 500 not only knifed through its widely followed 200-day moving average but also broke below its psychologically important 2,000 milestone marker, which it managed to recover by a small margin as we rebounded into the close. Before things got worse and to reduce exposure, I took the opportunity to sell some of our equity ETF positions. We’re still holding on to consumer staples, utilities and gold miners.
The Brexit largely affected bank stocks today, with shares of Barclays (BCS) closing down nearly 21% at $7.03, which marked a second consecutive trading day of double-digit losses for the stock. Britain’s exit also hit Royal Bank of Scotland (RBS), sending the bank’s shares down 13.6% to $4.69 close. The new drop followed a 27.5% plummet in the stock on Friday. Even U.S. bank stocks were not immune and got clobbered.
Our Trend Tracking Indexes (TTIs) have now slipped below their respective long term trend lines. For more details, please see section 3 below.
2. ETFs in the Spotlight
In case you missed the announcement and description of this section, you can read it here again.
It features 10 broadly diversified ETFs from my HighVolume list as posted every Monday. Furthermore, they are screened for the lowest MaxDD% number meaning they have been showing better resistance to temporary sell offs than all others over the past year.
Here are the 10 candidates:
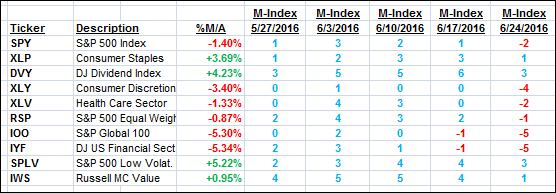
The above table simply demonstrates the magnitude with which some of the ETFs are fluctuating in regards to their positions above or below their respective individual trend lines (%M/A). A break below, represented by a negative number, shows weakness, while a break above, represented by a positive percentage, shows strength.
For hundreds of ETF/Mutual fund choices, be sure to reference Thursday’s StatSheet.
Year to date, here’s how the above candidates have fared so far:
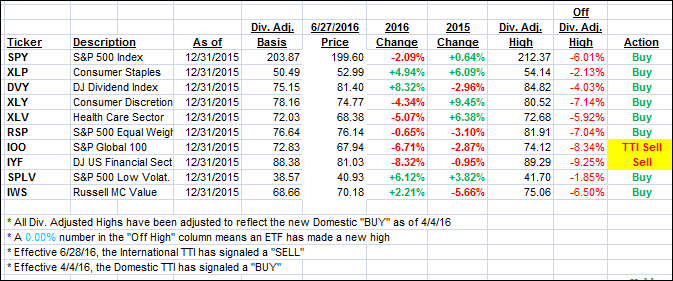
Again, the first table above shows the position of the various ETFs in relation to their respective long term trend lines (%M/A), while the second one tracks their trailing sell stops in the “Off High” column. The “Action” column will signal a “Sell” once the -7.5% point has been taken out in the “Off High” column.
3. Trend Tracking Indexes (TTIs)
Our Domestic Trend Tracking Index (TTI) succumbed to selling and dropped below its long-term trend line by -0.02%. Sure, while this constitutes a break, it certainly is not a very convincing one, so we’ll remain in “Buy” mode until a clearer picture emerges and the piercing of the trend line becomes more obvious.
The International TTI headed sharply south and is now firmly entrenched on the bearish side of its trend line. A new “Sell” signal for this arena will be effective as of tomorrow, June 28, 2016. Again, the affects only “broadly diversified international funds/ETFs.”
Here’s how we closed:
Domestic TTI: -0.02% (last close +0.66%)—Buy signal effective 4/4/2016
International TTI: -4.69% (last close -3.10%)—Sell signal effective 6/28/2016
Disclosure: I am obliged to inform you that I, as well as advisory clients of mine, own some of these listed ETFs. Furthermore, they do not represent a specific investment recommendation for you, they merely show which ETFs from the universe I track are falling within the guidelines specified.
Contact Ulli