
1. Moving the Markets
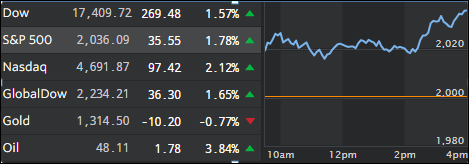
Markets on Tuesday flashed their first signs of stabilization as the Dow shot up more than 200 points following a sullied performance last week after the U.K. exit. I am sure equity indexes were oversold during the past couple of days, but it remains to be seen whether this is just hopeful bargain hunting combined with quarter-end window dressing or the resumption of the previous bull market. Global economic weakness and over-indebtedness are still lurking in the background and could put an end to this apparent volume-less dead cat bounce in a hurry.
Stocks that moved higher today include digital marketing company ReachLocal (RLOC) on its merger with Gannett (GCI), Cigna (CI) and SolarCity (SCTY) as Elon Musk’s solar systems maker formed a special committee to evaluate Tesla’s (TSLA) takeover bid. The panel’s creation is seeking to avoid any potential conflicts of interest between the two companies.
In pharma news, we heard today that U.S. pharmaceutical giant Pfizer (PFE) plans to invest roughly $350 million to develop a biotechnology center in China, which could increase the company’s footprint in the world’s second-largest pharmaceutical market. The new facility, which will be their first in China, will be built in Hangzhou and will provide both biologic treatments (medications made in microorganisms, plants or animal cells) for patients in China and worldwide.
2. ETFs in the Spotlight
In case you missed the announcement and description of this section, you can read it here again.
It features 10 broadly diversified ETFs from my HighVolume list as posted every Monday. Furthermore, they are screened for the lowest MaxDD% number meaning they have been showing better resistance to temporary sell offs than all others over the past year.
Here are the 10 candidates:
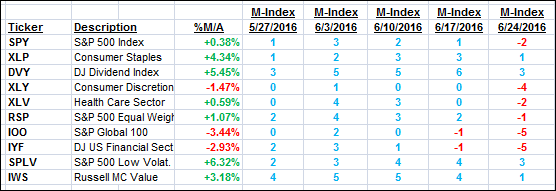
The above table simply demonstrates the magnitude with which some of the ETFs are fluctuating in regards to their positions above or below their respective individual trend lines (%M/A). A break below, represented by a negative number, shows weakness, while a break above, represented by a positive percentage, shows strength.
For hundreds of ETF/Mutual fund choices, be sure to reference Thursday’s StatSheet.
Year to date, here’s how the above candidates have fared so far:
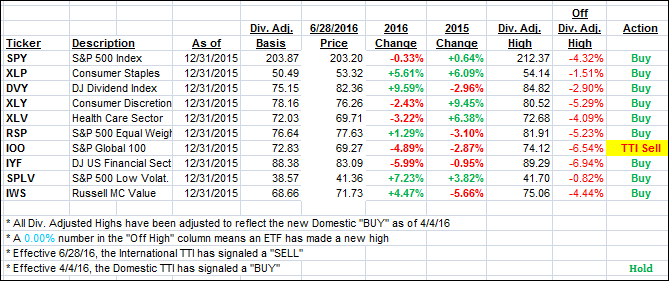
Again, the first table above shows the position of the various ETFs in relation to their respective long term trend lines (%M/A), while the second one tracks their trailing sell stops in the “Off High” column. The “Action” column will signal a “Sell” once the -7.5% point has been taken out in the “Off High” column.
3. Trend Tracking Indexes (TTIs)
Our Domestic Trend Tracking Index (TTI) climbed back above its trend line for the time being as the major indexes recouped some losses from the steep Brexit sell-off. Whether this rebound has legs is still wide open as volume was simply atrocious making this a questionable move.
Here’s how we ended up:
Domestic TTI: +0.76% (last close -0.02%)—Buy signal effective 4/4/2016
International TTI: -3.97% (last close -4.69%)—Sell signal effective 6/28/2016
Disclosure: I am obliged to inform you that I, as well as advisory clients of mine, own some of these listed ETFs. Furthermore, they do not represent a specific investment recommendation for you, they merely show which ETFs from the universe I track are falling within the guidelines specified.
Contact Ulli