
ETF/No Load Fund Tracker StatSheet
————————————————————-
————————————————————
Market Commentary
SOLID FRIDAY, BUT FOURTH STRAIGHT WEEKLY LOSS FOR DOW
1. Moving the Markets
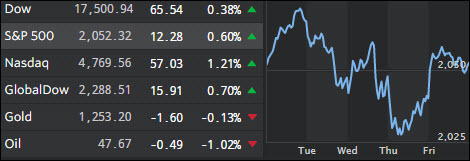
The Dow closed the week with a rally on Friday, but the gains were not enough to push the index into positive territory for the week. This marks the fourth straight week of losses as investors remain focused on what the Federal Reserve will do in June.
In a sign of recent market risk aversion, asset flows to bond-related mutual funds and ETFs hit $4.57 billion in the week ended May 18, while stock-related funds suffered net outflows of $.49 billion, according to Reuters.
In corporate news, shares of The Gap (GPS) were up 4.2% to close at $18.01 after the retailer reported earnings in line with market expectations and announced a restructuring, which includes the closure of 75 Old Navy and Banana Republic stores, mostly of which are international locations.
Also, shares of Yahoo (YHOO) fell 1.4% to $ $36.50 amid media reports that suggest the Internet Company has received lower-than-expected bids for its core business from potential suitors.
2. ETFs in the Spotlight
In case you missed the announcement and description of this section, you can read it here again.
It features 10 broadly diversified ETFs from my HighVolume list as posted every Monday. Furthermore, they are screened for the lowest MaxDD% number meaning they have been showing better resistance to temporary sell offs than all others over the past year.
Here are the 10 candidates:
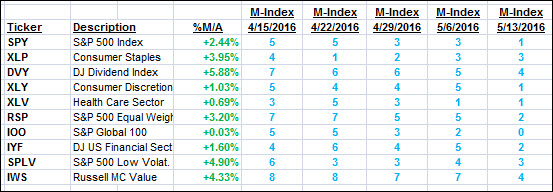
The above table simply demonstrates the magnitude with which some of the ETFs are fluctuating in regards to their positions above or below their respective individual trend lines (%M/A). A break below, represented by a negative number, shows weakness, while a break above, represented by a positive percentage, shows strength.
For hundreds of ETF/Mutual fund choices, be sure to reference Thursday’s StatSheet.
Year to date, here’s how the above candidates have fared so far:
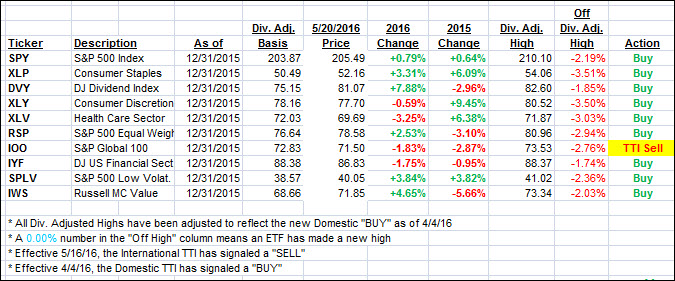
Again, the first table above shows the position of the various ETFs in relation to their respective long term trend lines (%M/A), while the second one tracks their trailing sell stops in the “Off High” column. The “Action” column will signal a “Sell” once the -7.5% point has been taken out in the “Off High” column.
3. Trend Tracking Indexes (TTIs)
Our Domestic Trend Tracking Index (TTI) recovered as the indexes managed to close in the green today. The International TTI remains in bearish territory.
Here’s how we closed this see-saw week:
Domestic TTI: +0.87% (last Friday +1.03%)—Buy signal effective 4/4/2016
International TTI: -0.91% (last Friday -1.72%)—Sell signal effective 5/16/2016
Have a great weekend.
Ulli…
Disclosure: I am obliged to inform you that I, as well as advisory clients of mine, own some of these listed ETFs. Furthermore, they do not represent a specific investment recommendation for you, they merely show which ETFs from the universe I track are falling within the guidelines specified.
————————————————————-
READER Q & A FOR THE WEEK
All Reader Q & A’s are listed at our web site!
Check it out at:
https://theetfbully.com/questions-answers/
———————————————————-
WOULD YOU LIKE TO HAVE YOUR INVESTMENTS PROFESSIONALLY MANAGED?
Do you have the time to follow our investment plans yourself? If you are a busy professional who would like to have his portfolio managed using our methodology, please contact me directly or get more details at:
https://theetfbully.com/personal-investment-management/
———————————————————
Back issues of the ETF/No Load Fund Tracker are available on the web at:
https://theetfbully.com/newsletter-archives/
Contact Ulli