
1. Moving the Markets
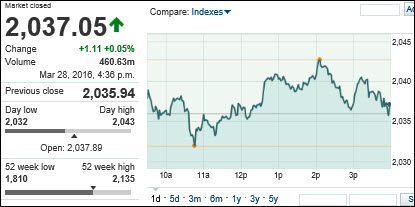
The major indexes closed moderately higher after a day with little volatility. Perhaps the hesitance in markets today was the fact that investors are waiting to react to more economic news this week that will provide further insight into the state of the slumping domestic economy.
Today, we received reports on personal income, consumer spending and pending home sales. Personal income data showed a slight 0.2% gain. Consumer spending was in line with expectations and pending home sales rose 3.5%, which topped expectations and signaled that the real estate recovery continues.
On Tuesday, we’ll hear March’s consumer confidence survey, but the big data point comes in on Friday when the government will issue its March jobs report. If the report comes in strong, it could signal a sooner than expected rate hike in April.
In M&A news today, General Motors (GM) received a solid regulatory approval to acquire Cruise Automation, a 3 year old startup company that has developed an autopilot system that GM is drooling over. Cruise has a device that will enable drivers to give complete control of the accelerator, brakes and steering to the car. The purchase price of the company was not reported, but rumors allege that GM paid around $1 billion.
2. ETFs in the Spotlight
In case you missed the announcement and description of this section, you can read it here again.
It features 10 broadly diversified ETFs from my HighVolume list as posted every Monday. Furthermore, they are screened for the lowest MaxDD% number meaning they have been showing better resistance to temporary sell offs than all others over the past year.
Here are the 10 candidates:
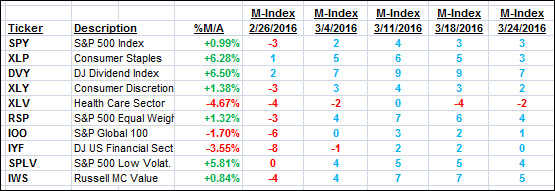
The above table simply demonstrates the magnitude with which some of the ETFs are fluctuating in regards to their positions above or below their respective individual trend lines (%M/A). A break below, represented by a negative number, shows weakness, while a break above, represented by a positive percentage, shows strength.
For hundreds of ETF/Mutual fund choices, be sure to reference Thursday’s StatSheet.
Year to date, here’s how the above candidates have fared so far:
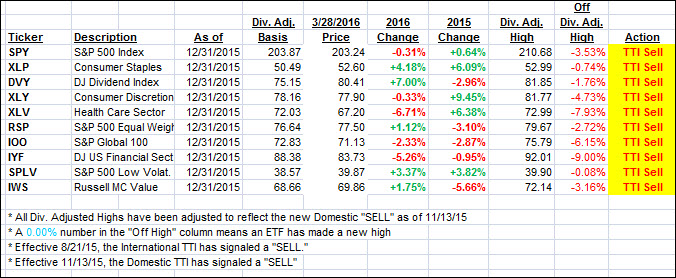
Again, the first table above shows the position of the various ETFs in relation to their respective long term trend lines (%M/A), while the second one tracks their trailing sell stops in the “Off High” column. The “Action” column will signal a “Sell” once the -7.5% point has been taken out in the “Off High” column.
3. Trend Tracking Indexes (TTIs)
Our Domestic Trend Tracking Index (TTI) barely changed as the major indexes went sideways ahead of Friday’s unemployment numbers.
Here’s how we ended up:
Domestic TTI: +0.35% (last close +0.27%)—Sell signal effective 11/13/2015
International TTI: -3.43% (last close -3.73%)—Sell signal effective 8/21/2015
Disclosure: I am obliged to inform you that I, as well as advisory clients of mine, own some of these listed ETFs. Furthermore, they do not represent a specific investment recommendation for you, they merely show which ETFs from the universe I track are falling within the guidelines specified.
Contact Ulli