
1. Moving the Markets
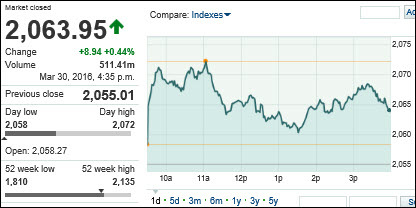
Markets remained strong the day after Janet Yellen stressed that the central bank will remain “cautious” in its approach to raising interest rates. In case you missed it, “cautious” means being accommodative to the financial markets no matter what.
Helping stocks higher today was another decline in the value of the U.S. dollar vs foreign currencies. Remember, a lower dollar helps sales and profits for U.S. multinationals, as well as oil and emerging markets.
Tech geeks’ eyes are waiting for the unveiling of Tesla’s (TSLA) new electric car this Thursday. The ‘Model 3’ will hit the market at a price tag of about $35,000, which will compete with Acura, BMW and other popular luxury brands, but at half the price of its current Model S sedan. The stock remains about at par with its starting price at the beginning of the year.
Oil, which remains at the forefront of market moving commodities, closed where it started, at $38.28 a barrel. Oil prices have risen about 50% over the past 2 months after the OPEC suggested ideas of slowing production. The $40 a barrel benchmark is still what investors are watching, however, the black gold has been on a mini slide closing lower for 6 days in a row.
Our Domestic TTI inched higher again and is now within shouting distance of a new “Buy” signal. Please see section 3 below for more details.
2. ETFs in the Spotlight
In case you missed the announcement and description of this section, you can read it here again.
It features 10 broadly diversified ETFs from my HighVolume list as posted every Monday. Furthermore, they are screened for the lowest MaxDD% number meaning they have been showing better resistance to temporary sell offs than all others over the past year.
Here are the 10 candidates:
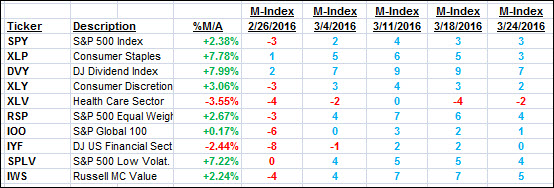
The above table simply demonstrates the magnitude with which some of the ETFs are fluctuating in regards to their positions above or below their respective individual trend lines (%M/A). A break below, represented by a negative number, shows weakness, while a break above, represented by a positive percentage, shows strength.
For hundreds of ETF/Mutual fund choices, be sure to reference Thursday’s StatSheet.
Year to date, here’s how the above candidates have fared so far:
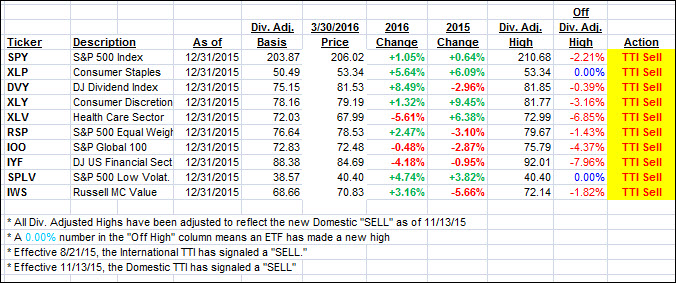
Again, the first table above shows the position of the various ETFs in relation to their respective long term trend lines (%M/A), while the second one tracks their trailing sell stops in the “Off High” column. The “Action” column will signal a “Sell” once the -7.5% point has been taken out in the “Off High” column.
3. Trend Tracking Indexes (TTIs)
Our Domestic Trend Tracking Index (TTI) is now within shouting distance of breaking its +1% level any day. With the Fed having signaled continued accommodation for Wall Street, there is a good chance that a new “Buy” signal will materialize—possibly tomorrow.
Since we have the all important market direction influencing jobs report coming out on Friday, I will off till Monday before pulling the trigger even if the TTI breaches the +1% level tomorrow.
The idea here is to be cautious and attempt to avoid a potential whip-saw signal. It’s also noteworthy that the International TTI, which was far more negative than its Domestic cousin, has come back with a vengeance and may very well move to the bullish side as well, although with some delay.
Here’s how we ended up:
Domestic TTI: +0.99% (last close +0.90%)—Sell signal effective 11/13/2015
International TTI: -1.96% (last close -2.48%)—Sell signal effective 8/21/2015
Disclosure: I am obliged to inform you that I, as well as advisory clients of mine, own some of these listed ETFs. Furthermore, they do not represent a specific investment recommendation for you, they merely show which ETFs from the universe I track are falling within the guidelines specified.
Contact Ulli