
1. Moving the Markets
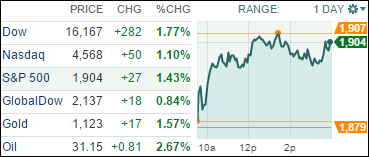
In a stunning reversal from yesterday’s sell-off, the likes of which I have described as typical in bear markets featuring big down days followed by big updays without clear long-term direction, oil rallied and pulled the indexes out of the doldrums with the S&P 500 reclaiming the 1,900 level. To be fair, strong earnings results from Johnson & Johnson, Proctor & Gamble as well as 3M contributed to today’s rebound.
Crude conquered the $31 level again on hopes that OPEC might be able to get a handle on the ever increasing supply levels, which to me is wishful thinking as I can’t recall an instance in recent history when OPEC managed to agree on anything that lasted more than a few days. In the end, if inventories build again all of a sudden, we may see the pendulum swing the other way pulling equities back down.
Unless, of course, tomorrow’s Fed announcement, after its 2-day FOMC meeting, contains a new recipe for potentially lower interest rates or a much hoped for new Quantitative Easing (QE) program.
All of our 10 ETFs in the Spotlight joined the party and closed up with the leader being the Mid-Cap Value ETF (IWS) with +2.26% while the laggard was Healthcare (XLV) with +0.76%.
2. ETFs in the Spotlight
In case you missed the announcement and description of this section, you can read it here again.
It features 10 broadly diversified ETFs from my HighVolume list as posted every Monday. Furthermore, they are screened for the lowest MaxDD% number meaning they have been showing better resistance to temporary sell offs than all others over the past year.
Here are the 10 candidates:
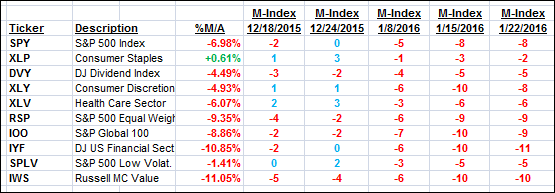
The above table simply demonstrates the magnitude with which some of the ETFs are fluctuating in regards to their positions above or below their respective individual trend lines (%M/A). A break below, represented by a negative number, shows weakness, while a break above, represented by a positive percentage, shows strength.
For hundreds of ETF/Mutual fund choices, be sure to reference Thursday’s StatSheet.
Year to date, here’s how the above candidates have fared so far:
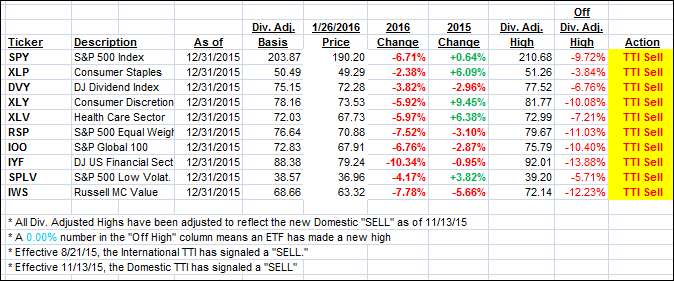
Again, the first table above shows the position of the various ETFs in relation to their respective long term trend lines (%M/A), while the second one tracks their trailing sell stops in the “Off High” column. The “Action” column will signal a “Sell” once the -7.5% point has been taken out in the “Off High” column.
3. Trend Tracking Indexes (TTIs)
Our Domestic Trend Tracking Index (TTI) went the other way and slipped slightly without having any effect on our bearish outlook.
Here’s how we closed:
Domestic TTI: -2.85% (last close -3.33%)—Sell signal effective 11/13/2015
International TTI: -10.37% (last close -11.28%)—Sell signal effective 8/21/2015
Disclosure: I am obliged to inform you that I, as well as advisory clients of mine, own some of these listed ETFs. Furthermore, they do not represent a specific investment recommendation for you, they merely show which ETFs from the universe I track are falling within the guidelines specified.
Contact Ulli