
1. Moving the Markets
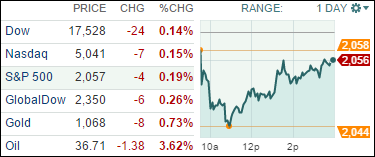
Stocks fell and oil prices took a tumble Monday, as the S&P 500 index kicked off the final week of the year by slipping back into the red in a volatile year that has made it tough for U.S. stocks to make much headway. Energy stocks led the declines as the recent uptick in oil prices also faltered. U.S. benchmark crude fell 3.3% to $36.85 a barrel.
We heard some positive news on the economic front today though. Holiday shoppers spent 7.9% more this year than they did in 2014, but they were expected to gravitate more toward online sellers, and brick-and-mortar retailers could feel the impact once the final numbers come out in early 2016.
As I said, it has been a challenging year for U.S. stocks. Domestic equities have been hurt by questions regarding the timing of the Federal Reserve’s first interest rate hike in nearly a decade (the Fed did in fact raise rates a quarter-point in mid-December), plunging oil prices, the negative impact of a strong dollar on sales and earnings of U.S. multinationals, and fears related to the slowdown in China’s economy, which is the world’s second-largest.
Wall Street is still hoping that the normal late-year rally, dubbed the Santa Claus Rally, will kick in this week. This time of year has historically been a seasonally strong period for stocks, as the market benefits from holiday-infused optimism and the benefit of a fresh influx of cash into the stock market as Americans put year-end bonuses to work.
2 of our 10 ETFs in the Spotlight managed to inch higher, led by the Low Volatility ETF (SPLV) with +0.31%. On the downside, we had a tie as Healthcare (XLV) and the Equal Weight S&P (RSP) each gave back -0.47%.
2. ETFs in the Spotlight
In case you missed the announcement and description of this section, you can read it here again.
It features 10 broadly diversified ETFs from my HighVolume list as posted every Monday. Furthermore, they are screened for the lowest MaxDD% number meaning they have been showing better resistance to temporary sell offs than all others over the past year.
Here are the 10 candidates:
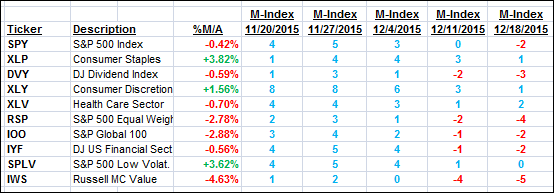
The above table simply demonstrates the magnitude with which some of the ETFs are fluctuating in regards to their positions above or below their respective individual trend lines (%M/A). A break below, represented by a negative number, shows weakness, while a break above, represented by a positive percentage, shows strength.
For hundreds of ETF/Mutual fund choices, be sure to reference Thursday’s StatSheet.
Year to date, here’s how the above candidates have fared so far:
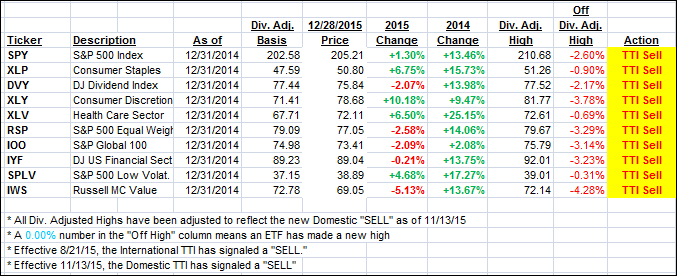
Again, the first table above shows the position of the various ETFs in relation to their respective long term trend lines (%M/A), while the second one tracks their trailing sell stops in the “Off High” column. The “Action” column will signal a “Sell” once the -7.5% point has been taken out in the “Off High” column.
3. Trend Tracking Indexes (TTIs)
Our Domestic Trend Tracking Index (TTI) barely changed and closed as follows:
Domestic TTI: -0.40% (last close -0.38%)—Sell signal effective 11/13/2015
International TTI: -4.08% (last close -3.78%)—Sell signal effective 8/21/2015
Disclosure: I am obliged to inform you that I, as well as advisory clients of mine, own some of these listed ETFs. Furthermore, they do not represent a specific investment recommendation for you, they merely show which ETFs from the universe I track are falling within the guidelines specified.
Contact Ulli