
1. Moving the Markets
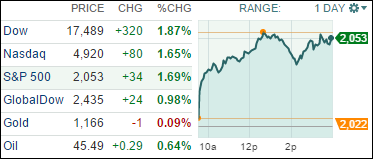
Stocks skyrocketed Thursday as investors were quite encouraged by a market moving earnings report posted by McDonald’s (MCD) and signs from Europe that more stimulus might be on the way for the European Economy. In the end, it was really ECBs Mario Draghi’s jawboning about “re-examining” its stimulus program, which lit some fire under the indexes.
McDonald’s topped earnings forecasts by 13 cents. The burger and fries giant also beat revenue forecasts, sparking a big rally in McDonald’s shares.
In earnings news, we heard from Google’s parent company Alphabet (GOOG) today. Wall Street cheered as the company delivered an earnings beat, as well as announcing that its board of directors had authorized the company to spend $5.1 billion buying back shares. Alphabet posted $7.35 a share excluding certain expenses. Analysts expected $7.20 a share, up 13% from $6.35 a share a year ago.
Microsoft (MSFT) and Amazon (AMZN) also impressed today with earnings reports that topped estimates. Microsoft announced it was gaining traction with its new Windows 10 operating system, which is now running on 110 million devices and the company also boasted about progress in the cloud space.
An earnings miss from financial services firm American Express (AXP), whose shares were down more than 5%, and heavy equipment maker Caterpillar (CAT) put a drag on the indexes.
9 of our 10 ETFs in the Spotlight ended higher with the loser of day being Healthcare (XLV) with a loss of -0.59%. Taking top honors on the upside was the Low Volatility S&P (SPLV) with +2.01%. Be sure to review section 3 below as our Domestic TTI is nearing a new “Buy” signal.
1. ETFs in the Spotlight
In case you missed the announcement and description of this section, you can read it here again.
It features 10 broadly diversified ETFs from my HighVolume list as posted every Monday. Furthermore, they are screened for the lowest MaxDD% number meaning they have been showing better resistance to temporary sell offs than all others over the past year.
Here are the 10 candidates:

The above table simply demonstrates the magnitude with which some of the ETFs are fluctuating in regards to their positions above or below their respective individual trend lines (%M/A). A break below, represented by a negative number, shows weakness, while a break above, represented by a positive percentage, shows strength.
For hundreds of ETF/Mutual fund choices, be sure to reference Thursday’s StatSheet.
Year to date, here’s how the above candidates have fared so far:
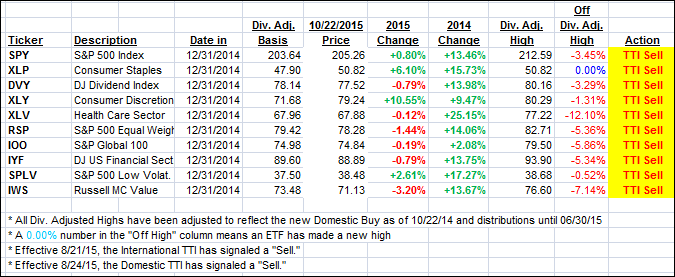
Again, the first table above shows the position of the various ETFs in relation to their respective long term trend lines (%M/A), while the second one tracks their trailing sell stops in the “Off High” column. The “Action” column will signal a “Sell” once the -7.5% point has been taken out in the “Off High” column.
3. Trend Tracking Indexes (TTIs)
Our Trend Tracking Indexes (TTIs) jumped today with the Domestic one now moving within striking distance of generating a new “Buy” signal. To elaborate, I like to see a clear break above the trend line along with some staying power before issuing a new signal in order to minimize the potential danger of a whip-saw signal. A mere “kissing” of the trend line by the TTI is not sufficient. I will comment further once we get there.
Here’s how we closed:
Domestic TTI: -0.15% (last close -0.87%)—Sell signal effective 8/24/2015
International TTI: -3.43% (last close -4.05%)—Sell signal effective 8/21/2015
Until the respective trend lines get clearly broken to the upside, we are staying on the sidelines.
Disclosure: I am obliged to inform you that I, as well as advisory clients of mine, own some of these listed ETFs. Furthermore, they do not represent a specific investment recommendation for you, they merely show which ETFs from the universe I track are falling within the guidelines specified.
Contact Ulli