
1. Moving the Markets
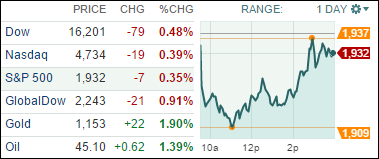
Equities climbed out of a deep dive Thursday, but the Nasdaq slid into negative territory for the calendar year as stocks posted their third straight loss.
The Dow took a hit from Caterpillar (CAT) after the company announced it would be cutting up to 5,000 jobs by the end of 2016 and could potentially shed up to 10,000 workers by the end of 2018. The stock dropped plunged more than 7% on the day.
Investors continue to grapple with a host of negatives, including the stock market’s inability to muster any signs of a lasting bounce, Volkswagen’s (VW) emissions crisis, and persistent worries over interest rates and China’s economic slowdown.
The good news on the economic front today was that the latest reading on weekly first-time initial jobless claims came in at 267,000, below the 272,000 analysts estimated but up slightly from 264,000 in the prior week. Durable goods orders for August fell 2%, but that was a little better than expectations.
Our 10 ETFs in the Spotlight were mixed again as an early sell-off turned into a rebound. Only 2 of them gained, led by the Dividend ETF (DVY) with +0.33% and 8 of them closed below the unchanged line with Healthcare (XLV) being the loser at -1.05%.
2. ETFs in the Spotlight
In case you missed the announcement and description of this section, you can read it here again.
It features 10 broadly diversified ETFs from my HighVolume list as posted every Monday. Furthermore, they are screened for the lowest MaxDD% number meaning they have been showing better resistance to temporary sell offs than all others over the past year.
Here are the 10 candidates:
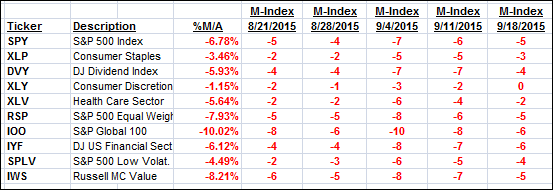
The above table simply demonstrates the magnitude with which some of the ETFs are fluctuating in regards to their positions above or below their respective individual trend lines (%M/A). A break below, represented by a negative number, shows weakness, while a break above, represented by a positive percentage, shows strength.
For hundreds of ETF/Mutual fund choices, be sure to reference Thursday’s StatSheet.
Year to date, here’s how the above candidates have fared so far:
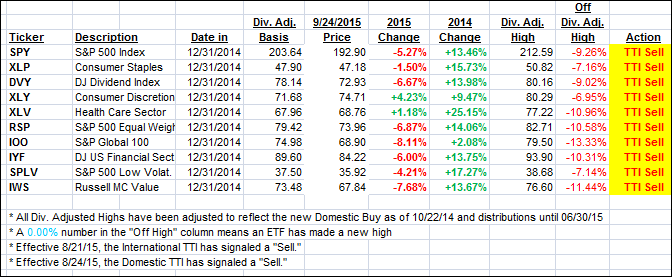
Again, the first table above shows the position of the various ETFs in relation to their respective long term trend lines (%M/A), while the second one tracks their trailing sell stops in the “Off High” column. The “Action” column will signal a “Sell” once the -7.5% point has been taken out in the “Off High” column.
3. Trend Tracking Indexes (TTIs)
Our Trend Tracking Indexes (TTIs) slid a little more and are now positioned as follows:
Domestic TTI: -2.36% (last close -2.14%)—Sell signal effective 8/24/2015
International TTI: -8.04% (last close -7.08%)—Sell signal effective 8/21/2015
Until the respective trend lines get clearly broken to the upside, we are staying on the sidelines.
Disclosure: I am obliged to inform you that I, as well as advisory clients of mine, own some of these listed ETFs. Furthermore, they do not represent a specific investment recommendation for you, they merely show which ETFs from the universe I track are falling within the guidelines specified.
Contact Ulli