
1. Moving the Markets
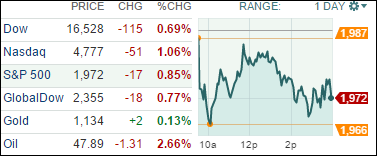
Uncertainty about the timing of Federal Reserve rate hikes and persistent fears about a China slowdown continued to weigh on financial markets after last week’s wild ride. Investors thought stocks may have stabilized by the end of last week, however, indexes tumbled and oil prices surged Monday as Wall Street closed out a volatile August with hefty losses that gave the S&P 500 its worst monthly performance since May 2012.
The losses were broad-based with nine out of the ten S&P sectors falling. Energy stocks were the only gainers as oil prices surged for a third straight day after the OPEC indicated they are prepared to discuss production levels. As a side note, Crude has jumped 27% in three days.
As for real estate, the sudden collapse in the Shanghai Composite and the devaluation of the yuan in the past month have led some to worry that it could cause trouble for the U.S. real estate. The reality is that potential capital flows from the turmoil in China can find safety in U.S. properties and the data speaks to it. Over the last 12 months, nearly $5.1 billion of $21.1 billion in commercial real estate investments coming from China has been allocated to the U.S market.
There were no green numbers to be found in our 10 ETFs in the Spotlight with all of them heading south. Faring the best was the Mid-Cap Value ETF (IWS) with a loss of -0.44%, while Healthcare (XLV) gave back the most by surrendering -1.82%.
Our Trend Tracking Indexes (TTIs) remain in bear market territory.
2. ETFs in the Spotlight
In case you missed the announcement and description of this section, you can read it here again.
It features 10 broadly diversified ETFs from my HighVolume list as posted every Monday. Furthermore, they are screened for the lowest MaxDD% number meaning they have been showing better resistance to temporary sell offs than all others over the past year.
Here are the 10 candidates:
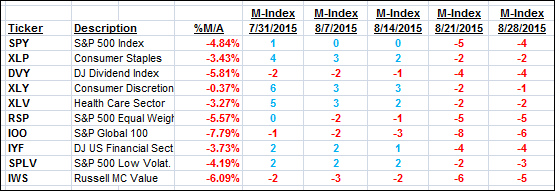
The above table simply demonstrates the magnitude with which some of the ETFs are fluctuating in regards to their positions above or below their respective individual trend lines (%M/A). A break below, represented by a negative number, shows weakness, while a break above, represented by a positive percentage, shows strength.
For hundreds of ETF/Mutual fund choices, be sure to reference Thursday’s StatSheet.
Year to date, here’s how the above candidates have fared so far:
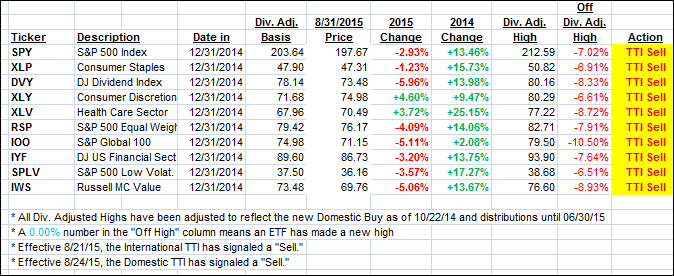
Again, the first table above shows the position of the various ETFs in relation to their respective long term trend lines (%M/A), while the second one tracks their trailing sell stops in the “Off High” column. The “Action” column will signal a “Sell” once the -7.5% point has been taken out in the “Off High” column.
3. Trend Tracking Indexes (TTIs)
Both of our Trend Tracking Indexes (TTIs) headed deeper into bear market territory by the following percentages:
Domestic TTI: -1.87% (last close -1.40%)—Sell signal effective 8/24/2015
International TTI: -4.69% (last close -4.11%)—Sell signal effective 8/21/2015
Until the respective trend lines get clearly broken to the upside, we are staying on the sidelines.
Disclosure: I am obliged to inform you that I, as well as advisory clients of mine, own some of these listed ETFs. Furthermore, they do not represent a specific investment recommendation for you, they merely show which ETFs from the universe I track are falling within the guidelines specified.
Contact Ulli