
ETF/No Load Fund Tracker StatSheet
————————————————————-
THE LINK TO OUR CURRENT ETF/MUTUAL FUND STATSHEET IS:
————————————————————
Market Commentary
CLOSING WITH A WHIMPER AFTER A TUMULTUOUS WEEK
1. Moving the Markets
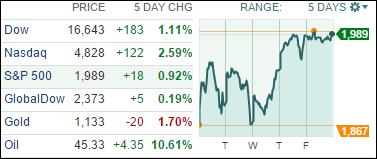
One look at the chart tells the entire story. It was a wild and tumultuous week that ended up on the plus side but could have just as easily gone the other way with the S&P 500 touching the 1,867 level. As posted, both of our main directional indicators, the Trend Tracking Indexes (TTIs), slipped below their long-term trend lines and remain in bearish territory despite the enormous 2-day rebound we saw on Wednesday and Thursday.
For the time being, this rebound has the look and feel of what we saw last October, when the markets capitulated for only 8 days, before the bulls gained the upper hand and upward momentum resumed. It’s too early to tell if we will get lucky again or if this time will be different. Our goal, when using the Trend Tracking approach, is to sidestep an oncoming bear market in order to avoid severe portfolio destruction.
At times, as we’ve seen in October 2014, it will turn out to be a false alarm, and we will need to re-establish our equity positions once the trend turns bullish again. Nobody knows for sure what’s next, but I think we will find out pretty soon if this week’s sudden rebound was a resumption of the previous trend or nothing but a giant head fake.
6 of our 10 ETFs in the Spotlight edged up slightly during this see-saw day. Leading the winners was the Select Dividend ETF (DVY) with +0.38%, while, on the losing side, Healthcare (XLV) took the dubious honors with a loss of -0.57%.
Our Trend Tracking Indexes (TTIs) remain in bear market territory as section 3 below shows.
2. ETFs in the Spotlight
In case you missed the announcement and description of this section, you can read it here again.
It features 10 broadly diversified ETFs from my HighVolume list as posted every Monday. Furthermore, they are screened for the lowest MaxDD% number meaning they have been showing better resistance to temporary sell offs than all others over the past year.
Here are the 10 candidates:
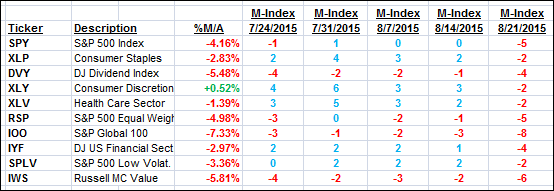
The above table simply demonstrates the magnitude with which some of the ETFs are fluctuating in regards to their positions above or below their respective individual trend lines (%M/A). A break below, represented by a negative number, shows weakness, while a break above, represented by a positive percentage, shows strength.
For hundreds of ETF/Mutual fund choices, be sure to reference Thursday’s StatSheet.
Year to date, here’s how the above candidates have fared so far:
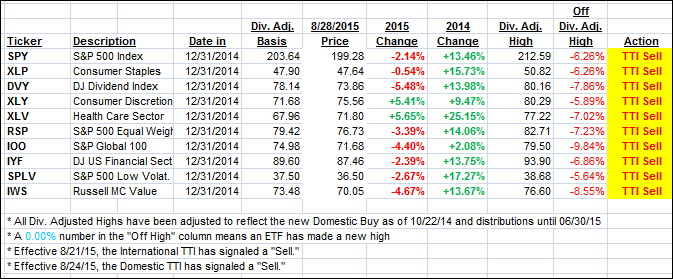
Again, the first table above shows the position of the various ETFs in relation to their respective long term trend lines (%M/A), while the second one tracks their trailing sell stops in the “Off High” column. The “Action” column will signal a “Sell” once the -7.5% point has been taken out in the “Off High” column.
3. Trend Tracking Indexes (TTIs)
Both of our Trend Tracking Indexes (TTIs) changed only slightly from yesterday and remain in bear market territory by the following percentages:
Domestic TTI: -1.40% (last Friday +0.64%)—Sell signal effective 8/24/2015
International TTI: -4.11% (last Friday -0.16%)—Sell signal effective 8/21/2015
Until the respective trend lines get clearly broken to the upside, we are staying on the sidelines.
Have a nice weekend.
Ulli…
Disclosure: I am obliged to inform you that I, as well as advisory clients of mine, own some of these listed ETFs. Furthermore, they do not represent a specific investment recommendation for you, they merely show which ETFs from the universe I track are falling within the guidelines specified.
————————————————————-
READER Q & A FOR THE WEEK
Reader Tad:
Q: Ulli: Hope all is well. Thanks for all you do!
Given the rapid and deep decline, it would seem that your Short Fund Composite (SFC) to be used as a trend indicator for Bear Market Funds would not only be above its TTI, but has had a clear piercing of the line to the upside resulting in a bullish signal. Is it time to buy SH?
A: Tad: Good observation. If you are the aggressive investor, you can. In my advisor practice, we’ll wait a while longer until volatility has subsided and the bearish trend has become clearly established. Right now, the market is still at a point where a whip-saw signal is a distinct possibility.
All Reader Q & A’s are listed at our web site!
Check it out at:
https://theetfbully.com/questions-answers/
———————————————————-
WOULD YOU LIKE TO HAVE YOUR INVESTMENTS PROFESSIONALLY MANAGED?
Do you have the time to follow our investment plans yourself? If you are a busy professional who would like to have his portfolio managed using our methodology, please contact me directly or get more details at:
https://theetfbully.com/personal-investment-management/
———————————————————
Back issues of the ETF/No Load Fund Tracker are available on the web at:
https://theetfbully.com/newsletter-archives/
Contact Ulli