
1. Moving the Markets
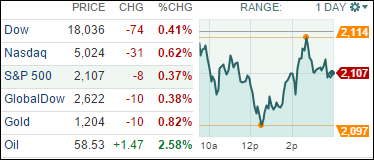
Stocks closed lower as investors digested weaker-than-expected economic growth and the latest statement from the Federal Reserve that indicated policymakers were still grappling with when to begin raising interest rates.
Continuing with Fed matters, The Federal Reserve gave a slight signal today that it could raise interest rates at any meeting, opening the door to the possibility of a mid-summer rate hike.
In M&A news, it was all about Salesforce.com (CRM) today. Shares of the company soared on a report that the cloud computing giant has hired sell-side advisors to field takeover inquiries. The stock gained 12% on the day to close at $74.65. Salesforce.com has a market value of nearly $50 billion, said S&P Capital IQ analyst Scott Kessler. Which would make it the largest ever takeover of a software company.
The only major earnings news was that of Fiat Chrysler Automobiles (FCAU). The company reported earnings per share of 52 cents compared with a loss of $1.55 per share for the same period a year ago. Those results accelerated way beyond analysts’ expectations of just 7 cents per share, however, the stock dropped 5.5% on the day.
All of our 10 ETFs in the Spotlight slumped and closed down. Holding up the best was IYF with a scant 0.10% loss, while SPLV gave back 1.00%.
2. ETFs in the Spotlight
In case you missed the announcement and description of this section, you can read it here again.
It features 10 broadly diversified ETFs from my HighVolume list as posted every Monday. Furthermore, they are screened for the lowest MaxDD% number meaning they have been showing better resistance to temporary sell offs than all others over the past year.
Here are the 10 candidates:
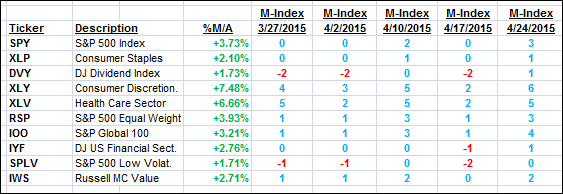
The above table simply demonstrates the magnitude with which some of the ETFs are fluctuating in regards to their positions above or below their respective individual trend lines (%M/A). A break below, represented by a negative number, shows weakness, while a break above, represented by a positive percentage, shows strength.
For hundreds of ETF/Mutual fund choices, be sure to reference Thursday’s StatSheet.
Year to date, here’s how the above candidates have fared so far:
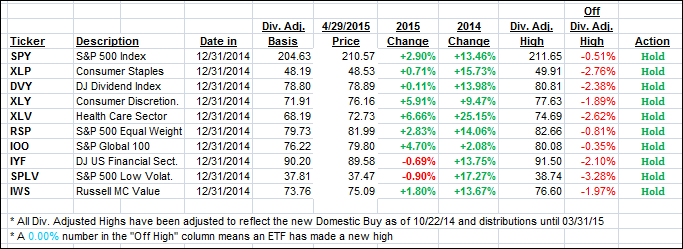
Again, the first table above shows the position of the various ETFs in relation to their respective long term trend lines (%M/A), while the second one tracks their trailing sell stops in the “Off High” column. The “Action” column will signal a “Sell” once the -7.5% point has been taken out in the “Off High” column.
3. Trend Tracking Indexes (TTIs)
Our Trend Tracking Indexes (TTIs) retreated but remain on the bullish side of their trend lines.
Here’s how we closed:
Domestic TTI: +2.96% (last close +3.25%)—Buy signal effective 10/22/2014
International TTI: +4.97% (last close +5.30%)—Buy signal effective 2/13/2015
Disclosure: I am obliged to inform you that I, as well as advisory clients of mine, own some of these listed ETFs. Furthermore, they do not represent a specific investment recommendation for you, they merely show which ETFs from the universe I track are falling within the guidelines specified.
Contact Ulli