
1. Moving the Markets
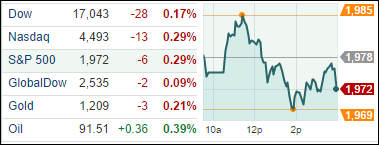
Well, we can check this month off as the worst for the markets since January.
The S&P 500 finished the month down just over 1.5%, the Nasdaq dropped 1.9% and the Dow ended down 0.3%.
It seems that throughout the month stocks have been hurt by conflict abroad, in places like Ukraine, Iraq and Syria. Additionally, recent pro-democracy protests in Hong Kong have added to geopolitical risk. Investors have also had to come to grips with the fact that the Fed will soon have to start raising interest rates.
If you owned shares of health care ETFs in the third quarter though, you fared pretty well given the fact that the largest gains have come in the healthcare sector. Across the market, healthcare stocks are up 6% for the quarter.
Lastly, let’s talk about gas. With crude oil prices plunging to near two-year lows and likely to remain tepid through year’s end, consumers in all but a handful of states could soon pay $3 a gallon or less for gasoline, the lowest pump prices since 2010. Rising global oil production, ample inventories, slackening demand and a strong U.S. dollar have all put pressure on the global oil markets recently. Today, Brent crude fell 2.4% to $94.83.
9 of our 10 ETFs in the Spotlight slipped as the markets meandered with a downside bias.
2. ETFs in the Spotlight
In case you missed the announcement and description of this section, you can read it here again.
It features 10 broadly diversified ETFs from my HighVolume list as posted every Monday. Furthermore, they are screened for the lowest MaxDD% number meaning they have been showing better resistance to temporary sell offs than all others over the past year.
Here are the 10 candidates:
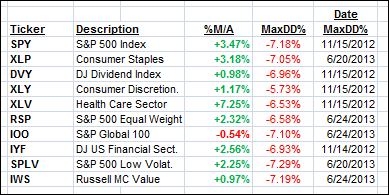
All of them, except IOO, are currently in “buy” mode, meaning their prices are above their respective long term trend lines by the percentage indicated (%M/A).
Year to date, here’s how the above candidates have fared so far:
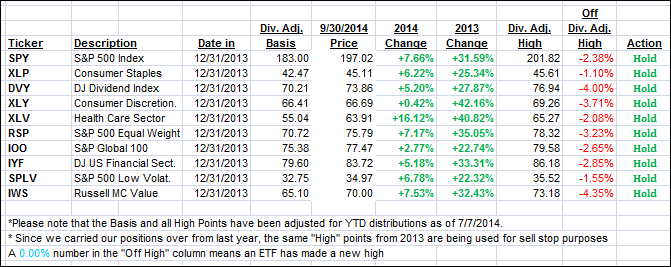
To be clear, the first table above shows the position of the various ETFs in relation to their respective long term trend lines (%M/A), while the second one tracks their trailing sell stops in the “Off High” column. The “Action” column will signal a “Sell” once the -7.5% point is taken out in the “Off High” column.
3. Domestic Trend Tracking Indexes (TTIs)
Our Trend Tracking Indexes (TTIs) headed south with the International one now sinking deeper into bear market territory. Barring any huge rebound rally tomorrow, I consider this International Buy cycle, which started on 8/21/2012, to be over and no longer recommend any holdings in “broadly diversified international mutual funds/ETFs”:
Domestic TTI: +1.18% (last close +1.55%)
International TTI: -0.73% (last close -0.48%)
A new international Buy cycle will be generated once the above TTI penetrates its long-term trend line to the upside by a clear margin. Stay tuned for further updates.
Disclosure: I am obliged to inform you that I, as well as advisory clients of mine, own some of these listed ETFs. Furthermore, they do not represent a specific investment recommendation for you, they merely show which ETFs from the universe I track are falling within the guidelines specified.
Contact Ulli