1. Moving The Markets
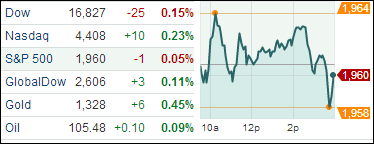
Both the Dow and S&P 500 lost ground slightly after flirting with record highs previously. We are now officially halfway through the trading year and the S&P 500 is up 6%, logging 22 record highs along the way. Over the past two months stocks have resumed their upward trajectory after getting off to their worst start in five years in the first quarter.
Utility stocks also did well. The sector rose 0.8%, making it the biggest gainer of the 10 industry sectors that make up the S&P 500 industry. The utilities sector has done very well overall this year, climbing 16.4% thus far as bond yields have fallen.
American Apparel (APP) dropped 6% after the company announced plans to adopt a shareholder rights plan in an effort to prevented ousted chairman (and founder) Dov Charney from seizing control. The sell-off follows a surge of nearly 30% on Friday.
General Motor (GM) was among the day’s losers. Trading in the auto titan’s stock was briefly suspended in the afternoon after the company announced that it was recalling at least 7.6 million more vehicles dating back to 1997 to fix faulty ignition switches.
Today’s aimless meandering on the last day of the month proved to be a non-event for our ETFs in the Spotlight, although 2 of them managed to make new highs.
2. ETFs in the Spotlight
In case you missed the announcement and description of this section, you can read it here again.
It features 10 broadly diversified ETFs from my HighVolume list as posted every Monday. Furthermore, they are screened for the lowest MaxDD% number meaning they have been showing better resistance to temporary sell offs than all others over the past year.
In other words, none of them ever triggered their 7.5% sell stop level during this time period, which included a variety of severe market pullbacks but no move into outright bear market territory.
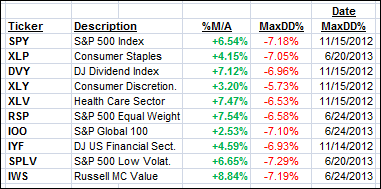
Here are the 10 candidates:
All of them are in “buy” mode, meaning their prices are above their respective long term trend lines by the percentage indicated (%M/A).
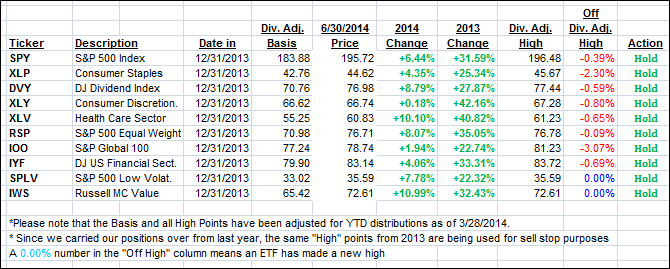
Year to date, here’s how the above candidates have fared so far:
To be clear, the first table above shows the position of the various ETFs in relation to their respective long term trend lines (%M/A), while the second one tracks their trailing sell stops in the “Off High” column. The “Action” column will signal a “Sell” once the -7.5% point is taken out in the “Off High” column.
3. Domestic Trend Tracking Indexes (TTIs)
Our Trend Tracking Indexes (TTIs) again were mixed with no major changes:
Domestic TTI: +3.65% (last close +3.63%)
International TTI: +4.14% (last close +3.92%)
Disclosure: I am obliged to inform you that I, as well as advisory clients of mine, own some of these listed ETFs. Furthermore, they do not represent a specific investment recommendation for you, they merely show which ETFs from the universe I track are falling within the guidelines specified.
Contact Ulli


