
1. Moving The Markets
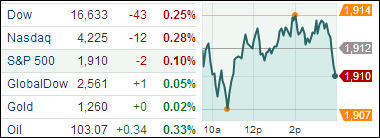
Stocks pulled back today and decided to take a breather after hitting record highs during the previous two trading days. The S&P 500 closed out the day slightly down with the Dow and Nasdaq also ending in negative territory.
Amongst the movers and shakers today was Toll Brothers Inc. (TOL) Toll Brothers Inc., which gained on a strong U.S. housing report and the news that the builder doubled its Q2 profit. Qihoo 360 Technology Co. (QIHU), the Chinese internet security company, jumped up 5% today after releasing numbers that topped analyst expectations, as well as a strong financial forecast.
Retail shoe giant DSW Inc. (DSW) suffered a massive drop in price today ($8.90) to $23.62 after releasing some appalling Q1 numbers alongside an even worse forecast for the next quarter.
On the economic front, investors are awaiting the government’s revised estimate of first-quarter economic growth, which will be released tomorrow. Economists expect the report to show that the nation’s GDP fell by about half a percentage point at an annual rate the first three months of 2014. Many continue to believe that unusually harsh weather is responsible for much of the first quarter’s weakness. Was it that cold?
Our 10 ETFs in the Spotlight went nowhere but 1 of them made a new high despite the sideways pattern; 9 of them remain on the plus side YTD.
2. ETFs in the Spotlight
In case you missed the announcement and description of this section, you can read it here again.
It features 10 broadly diversified ETFs from my HighVolume list as posted every Monday. Furthermore, they are screened for the lowest MaxDD% number meaning they have been showing better resistance to temporary sell offs than all others over the past year.
In other words, none of them ever triggered their 7.5% sell stop level during this time period, which included a variety of severe market pullbacks but no move into outright bear market territory.
Here are the 10 candidates:
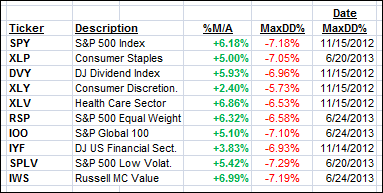
All of them are in “buy” mode, meaning their prices are above their respective long term trend lines by the percentage indicated (%M/A).
Year to date, here’s how the above candidates have fared so far:
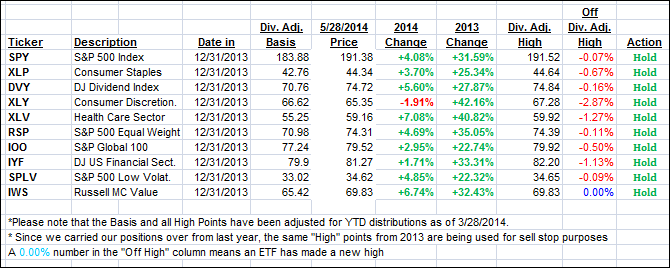
To be clear, the first table above shows the position of the various ETFs in relation to their respective long term trend lines (%M/A), while the second one tracks their trailing sell stops in the “Off High” column. The “Action” column will signal a “Sell” once the -7.5% point is taken out in the “Off High” column.
3. Domestic Trend Tracking Indexes (TTIs)
Our Trend Tracking Indexes (TTIs) went sideways and hardly changed for the day:
Domestic TTI: +3.20% (last close +3.22%)
International TTI: +4.22% (last close +4.32%)
Disclosure: I am obliged to inform you that I, as well as advisory clients of mine, own some of these listed ETFs. Furthermore, they do not represent a specific investment recommendation for you, they merely show which ETFs from the universe I track are falling within the guidelines specified.
Contact Ulli