

1. Moving The Markets
The Dow and the S&P 500 closed down for a fourth consecutive session as uncertainty grew over when the Federal Reserve will start to slow its stimulus. The decline today coincides with the updated employment numbers arriving from ADP. Private sector job creation surged in November; with ADP reporting 215,000 (higher than the 173,000 forecast) new jobs in a number that could also put some heat on the Federal Reserve to begin reducing its monthly stimulus.
European equities also closed lower on Wednesday for a third-straight day, following the U.S. markets in concerns over the Fed. Also in Europe, bank stocks saw a sell-off today. Some of the world’s biggest banks were hit with a 1.7 billion euro ($2.3 billion) fine for interest rate-rigging by traders, the largest fine ever imposed by the European Commission (EC).
In housing, the average rate for a 30-year mortgage fell 30 basis points from September to October, and new home sales responded with their biggest monthly jump in more than 33 years. With rates on the rise, new home sales may dip again, though.
The Direxion Daily FTSE China Bull 3X Shares (YINN) and Direxion Daily FTSE China Bear 3X Shares (YANG) will begin following their new index on 12 December, making them the first pair of 3X leveraged and inverse ETFs in the US to track this composite, which offers exposure to some of the most prominent companies in China.
Our ETFs in the Spotlight continued to slip off their highs. Let’s take a look:
2. ETFs in the Spotlight
In case you missed the announcement and description of this section, you can read it here again.
It features 10 broadly diversified ETFs from my HighVolume list as posted every Monday. Furthermore, they are screened for the lowest MaxDD% number meaning they have been showing better resistance to temporary sell offs than all others over the past year.
In other words, none of them ever triggered their 7.5% sell stop level during this time period, which included a variety of severe market pullbacks but no move into outright bear market territory.
Here are the 10 candidates:
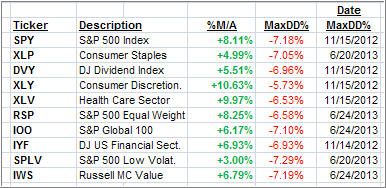
All of them are in “buy” mode meaning their prices are above their respective long term trend lines by the percentage indicated (%M/A).
Now let’s look at the MaxDD% column and review the ETF with the lowest drawdown as an example. As you can see, that would be XLY with the lowest MaxDD% number of -5.73%, which occurred on 11/15/2012.
The recent sell off in the month of June did not affect XLY at all as its “worst” MaxDD% of -5.73% still stands since the November 2012 sell off.
A quick glance at the last column showing the date of occurrences confirms that five of these ETFs had their worst drawdown in November 2012, while the other five were affected by the June 2013 swoon, however, none of them dipped below their -7.5% sell stop.
Year to date, here’s how the above candidates have fared so far:
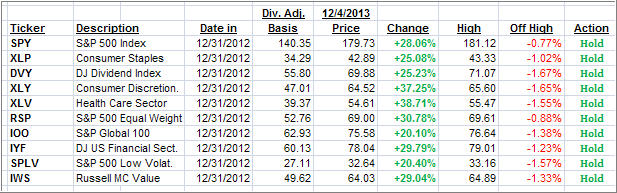
With the sell off of the past 4 days, all ETFs have come off their highs but by rather modest percentages. A pullback has been long ovderdue given the excellent YTD performances.
3. Domestic Trend Tracking Indexes (TTIs)
Trend wise, our Trend Tracking Indexes (TTIs) followed the markets lower but remain above their long term trend lines by the following percentages:
Domestic TTI: +4.17% (last close +4.42%)
International TTI: +5.95% (last close +6.42%)
Disclosure: I am obliged to inform you that I, as well as advisory clients of mine, own some of these listed ETFs. Furthermore, they do not represent a specific investment recommendation for you, they merely show which ETFs from the universe I track are falling within the guidelines specified.
Contact Ulli
Comments 2
I didnot find the 7 ETF portfolios. Income port did the best, wonder what happened to others in a year with SPX up near 20%?
Mike,
This is what I posted last week about the discontinuation of the model portfolios as they have been replaced buy the daily update of the ETFs in the Spotlight:
https://theetfbully.com/2013/11/7-etf-model-portfolios-you-can-use-updated-through-11262013/?preview=true
Ulli…