
1. Moving The Markets
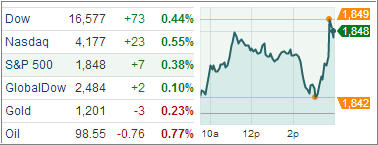
The S&P 500 along with the Dow Industrials kept its upward momentum intact during this last trading day by closing out this year at new record levels. As it stands, the Fed’s decision earlier this month to start tapering was taken as a positive, which helped the indexes to keep the rally going.
Of course, the Fed’s action was speculated on and anticipated throughout this year, so by the time the trigger was actually pulled, it no longer was a surprise, and the markets handled it in stride despite a momentary sell off.
The strength of equities was surprising given the fact that bonds hit the skids earlier this year, slipped into bear market territory and never recovered in any meaningful way. Lots of speculation abounds about what the markets will do next year. My suggestion is that you pay no attention to these exercises in futility and focus on the the long-term trend. Combine the direction of the trend with my recommended sell stop discipline, and you can eliminate much of the guesswork as to what might or might not happen.
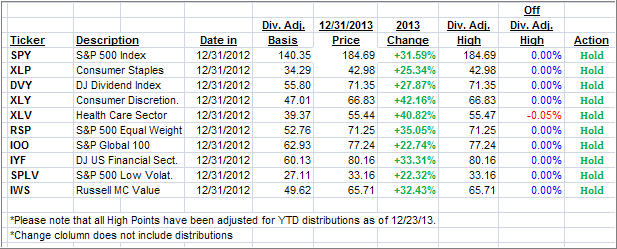
With the continuation of the current upside momentum in equities, nine of our ten ETFs in the Spotlight made new highs today. Take a look at the YTD table below.
2. ETFs in the Spotlight
In case you missed the announcement and description of this section, you can read it here again.
It features 10 broadly diversified ETFs from my HighVolume list as posted every Monday. Furthermore, they are screened for the lowest MaxDD% number meaning they have been showing better resistance to temporary sell offs than all others over the past year.
In other words, none of them ever triggered their 7.5% sell stop level during this time period, which included a variety of severe market pullbacks but no move into outright bear market territory.
Here are the 10 candidates:
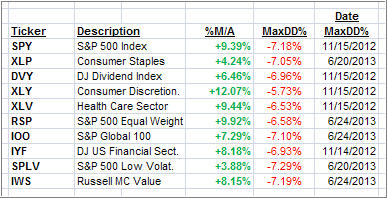
All of them are in “buy” mode meaning their prices are above their respective long term trend lines by the percentage indicated (%M/A).
Now let’s look at the MaxDD% column and review the ETF with the lowest drawdown as an example. As you can see, that would be XLY with the lowest MaxDD% number of -5.73%, which occurred on 11/15/2012.
The sell off in the month of June 2013 did not affect XLY at all as its “worst” MaxDD% of -5.73% still stands since the November 2012 sell off.
A quick glance at the last column showing the date of occurrences confirms that five of these ETFs had their worst drawdown in November 2012, while the other five were affected by the June 2013 swoon, however, none of them dipped below their -7.5% sell stop.
Year to date, here’s how the above candidates have fared so far:
3. Domestic Trend Tracking Indexes (TTIs)
Looking at the big picture, our Trend Tracking Indexes (TTIs) continue to advance with the overall positive tone in the market and remain above their long term trend lines by the following percentages:
Domestic TTI: +4.79% (last close +4.68%)
International TTI: +7.49% (last close +7.31%)
At this time, I like to wish you a Happy New Year!
Contact Ulli