
1. Moving The Markets
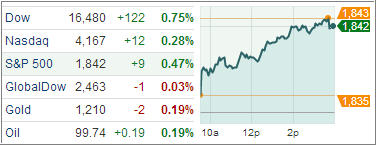
Following the theme from last week, domestic equities extended their record run, as the bulls had their way again pushing the major indexes, and our 10 ETFs in the Spotlihgt, into record territory.
Throwing an assist and keeping the upward trend alive was the Labor Department’s report, which said that the number of Americans claiming weekly unemployment benefits for the first time dropped by 42,000 to 338,000. Of course, these figures tend to be volatile, but right now they’re indicating that workers are gaining some means of confidence in the job market.
On the other side of the coin, the bear market in bonds/treasuries continues as the benchmark 10-year hit the 3% level today for the first time since September as rates moved higher.
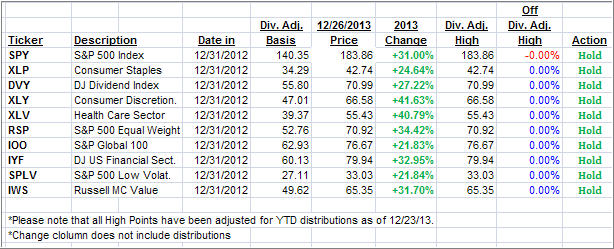
With the continuation of recent upside momentum in equities, all of our ten ETFs in the Spotlight made new highs today. Take a look at the YTD table below.
2. ETFs in the Spotlight
In case you missed the announcement and description of this section, you can read it here again.
It features 10 broadly diversified ETFs from my HighVolume list as posted every Monday. Furthermore, they are screened for the lowest MaxDD% number meaning they have been showing better resistance to temporary sell offs than all others over the past year.
In other words, none of them ever triggered their 7.5% sell stop level during this time period, which included a variety of severe market pullbacks but no move into outright bear market territory.
Here are the 10 candidates:
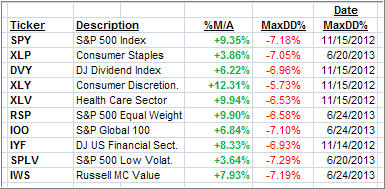
All of them are in “buy” mode meaning their prices are above their respective long term trend lines by the percentage indicated (%M/A).
Now let’s look at the MaxDD% column and review the ETF with the lowest drawdown as an example. As you can see, that would be XLY with the lowest MaxDD% number of -5.73%, which occurred on 11/15/2012.
The recent sell off in the month of June did not affect XLY at all as its “worst” MaxDD% of -5.73% still stands since the November 2012 sell off.
A quick glance at the last column showing the date of occurrences confirms that five of these ETFs had their worst drawdown in November 2012, while the other five were affected by the June 2013 swoon, however, none of them dipped below their -7.5% sell stop.
Year to date, here’s how the above candidates have fared so far:
3. Domestic Trend Tracking Indexes (TTIs)
Looking at the big picture, our Trend Tracking Indexes (TTIs) continue to advance with the overall positive tone in the market and remain above their long term trend lines by the following percentages:
Domestic TTI: +4.77% (last close +4.52%)
International TTI: +6.83% (last close +6.57%)
Contact Ulli