
1. Moving The Markets
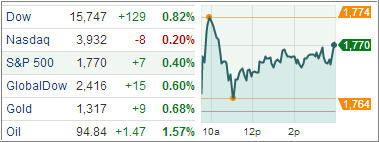
European equities headed higher supported by strong readings on factories and hopes that the ECB may take additional easing steps. That proved to be a springboard for the domestic indexes which, after an early rally, pulled back and then slowly inched their way higher with the DIA reaching a closing high.
Again, it seems the path of least resistance is up if there is no specific news to the contrary. Leading the ETF pack were utilities (XLU), which gained over 1.36% followed by consumer staples (XLP) with a strong 1.08%.
Analysts in general consider the current environment bullish for equities due to a positive third quarter earnings season, along with positive investor sentiment caused by the assumption of the Fed holding off on tapering until March. Nevertheless, it pays to be cautious, especially in view of the widespread complacency in the market place.
Let’s review the new ETF section below:
2. ETFs in the Spotlight
In case you missed the announcement and description of this section, you can read it here again.
It features 10 broadly diversified ETFs from my HighVolume list as posted every Monday. Furthermore, they are screened for the lowest MaxDD% number meaning they have been showing better resistance to temporary selloffs than all others over the past year.
In other words, all of them never triggered their 7.5% sell stop level during this time period, which included a variety of severe market pullbacks but no move into outright bear market territory.
Here are the 10 candidates:
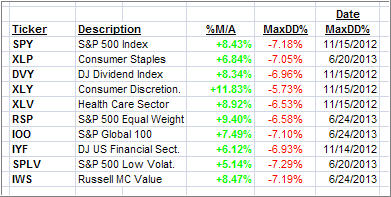
All of them are in “buy” mode meaning their prices are above their respective long term trend lines by the percentage indicated (%M/A).
Now let’s look at the MaxDD% column and review the ETF with the lowest drawdown as an example. As you can see, that would be XLY with the lowest MaxDD% number of -5.73%, which occurred on 11/15/2012.
The recent sell off in the month of June did not affect XLY at all as its “worst” MaxDD% of -5.73% still stands since the November 2012 sell off.
A quick glance at the last column showing the date of occurrences confirms that five of these ETFs had their worst drawdown in November 2012, while the other five were affected by the June 2013 swoon, however, none of them dipped below their -7.5% sell stop.
Year to date, here’s how the above candidates have fared so far:
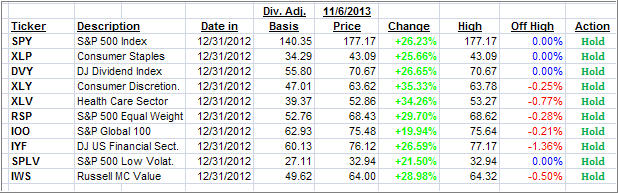
The 0.00% in the Off High column means that this ETF has made new highs for the year, which is a sign of strong upward momentum.
3. Domestic Trend Tracking Indexes (TTIs)
Trend wise, our Trend Tracking Indexes (TTIs) headed back up and remain above their long term trend lines by the following percentages:
Domestic TTI: +4.59%
International TTI: +7.42%
Disclosure: I am obliged to inform you that I, as well as advisory clients of mine, own some of these listed ETFs. Furthermore, they do not represent a specific investment recommendation for you, they merely show which ETFs from the universe I track are falling within the guidelines specified.
Contact Ulli
Comments 6
Ulli, I llke the new format of the daily blog posts. A couple of comments: I hope part 2 is not going to be the exact same every day. It’s only Wednesday and I am already bored with part 2 and skipping over it. Also, I would find part 3’s TTI% to be more useful if there was a comparison to yesterday’s or last week’s % like you do in the weekly summary. Thanks for a great blog.
Ulli – This new tack of yours is most welcome! It is a fine step forward in your methodology, but especially in the presentation, making it all much easier to implement thoughtful investing with a resolute plan.
Thank you,
Don Porter
Ulli – If we’re not invested in the market, how would we go about getting in at this time, if that is advisable at all.
Thanks
Mark,
In part 2, the %M/A gets updated daily, which becomes of greater importance once the markets start sliding and heading towards their long-term trend line. There are a lot of new readers coming aboard, so I need to keep the rest of the section intact. Simply skip over what is not of interest to you.
Good idea with the TTIs. I will add the previous day’s closing number as of today.
Ulli…
Ian,
For those with a conservative bias, I recommend my incremental buying strategy, which is explained in detail in my video on my blog. It’s not the one at the top right. Scroll down a bit and look for the one titled “How to know your investment risk.”
Ulli…
Thanks for your kind words, Don…
Ulli…