Do you want to know which ETFs are hot and which ones are not? Then you need my High-Volume ETF Cutline report. It tells you how close or far each of the 311 ETFs I follow is from its long-term trend line (39-week SMA). These are the ETFs that trade more than $5 million a day, so they are not some obscure funds that nobody cares about.
The report is split into two parts: The winners that are above their trend line (%M/A), and the losers that are below it. The yellow line is the line of shame that separates them. You can see how many ETFs are in each group and how they have changed since the last report (256 vs. 266 current).
MARKET RALLIES INTO WEEK’S END, BUT EU TRADE DEADLINE STILL LOOMS
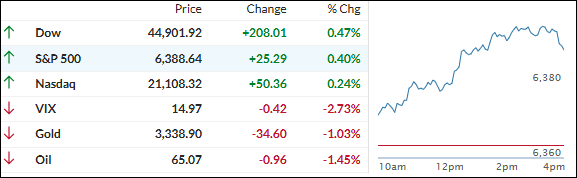
[Chart courtesy of MarketWatch.com]
Moving the market
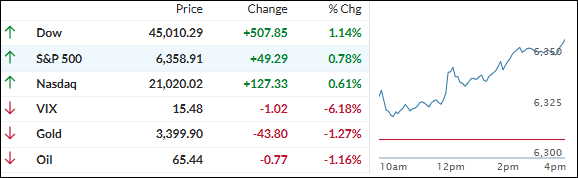
The major indexes kicked off the final trading day of the week on a high note, looking set to close out with solid gains. The S&P 500 led the way, while Small Caps and the Nasdaq lagged a bit.
Thursday marked the S&P 500’s 13th record close of the year—and impressively, four of those records came just this week. The Nasdaq wasn’t far behind, notching three new all-time highs of its own.
A strong earnings season has been a real boost, especially thanks to standout reports from Alphabet and Verizon, whose shares jumped 4% and 5% for the week. As of now, over 82% of the 169 S&P 500 companies reporting have topped Wall Street’s expectations—a stat that’s fueling even more optimism.
The fundamentals are pretty friendly for bulls right now: inflation is steady, interest rates are staying in their range, and corporate earnings are showing a solid uptrend. Add to that some recent progress on trade agreements—including with Japan—and the market mood has definitely brightened.
The one big question mark is whether the U.S. can hammer out a deal with the European Union before the August 1 deadline. That remains the market’s biggest unknown, but optimism is still holding up.
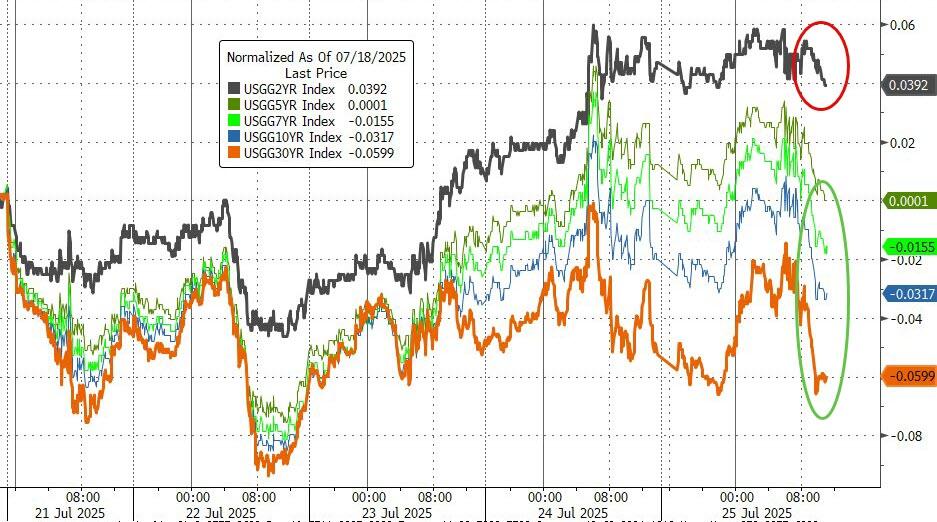
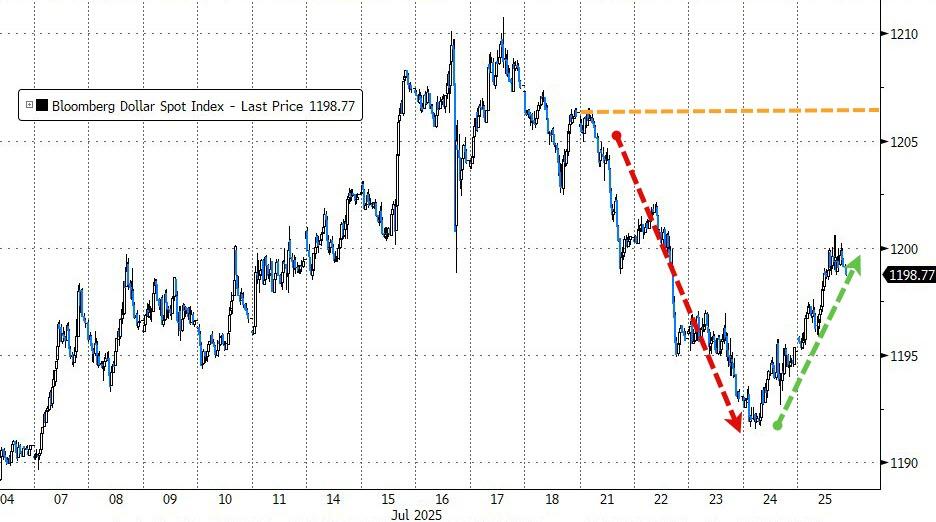
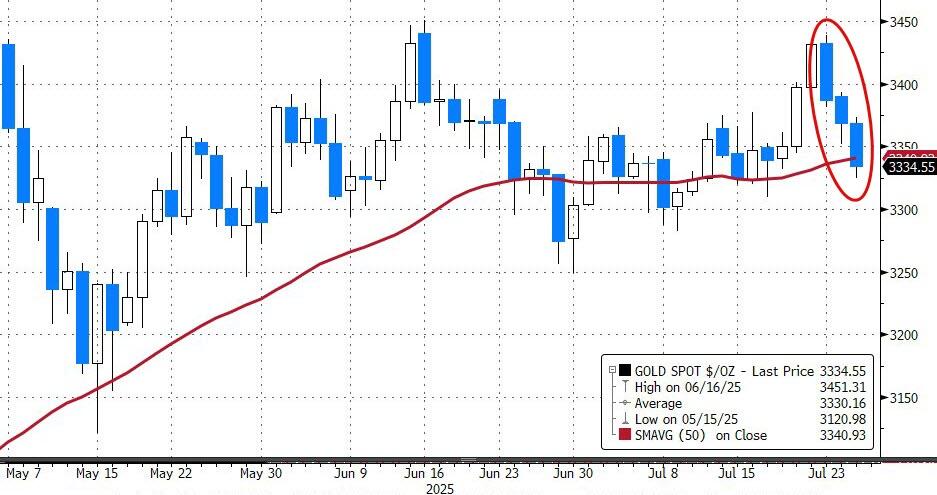
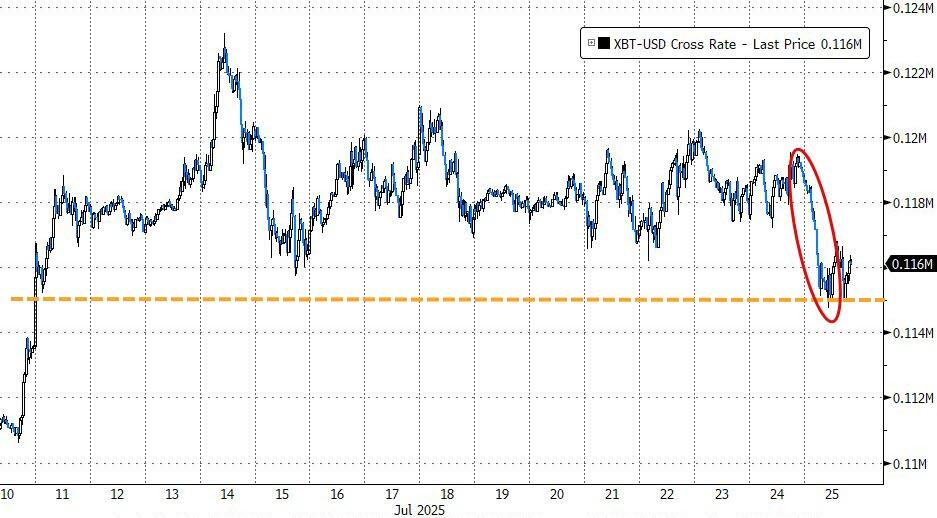
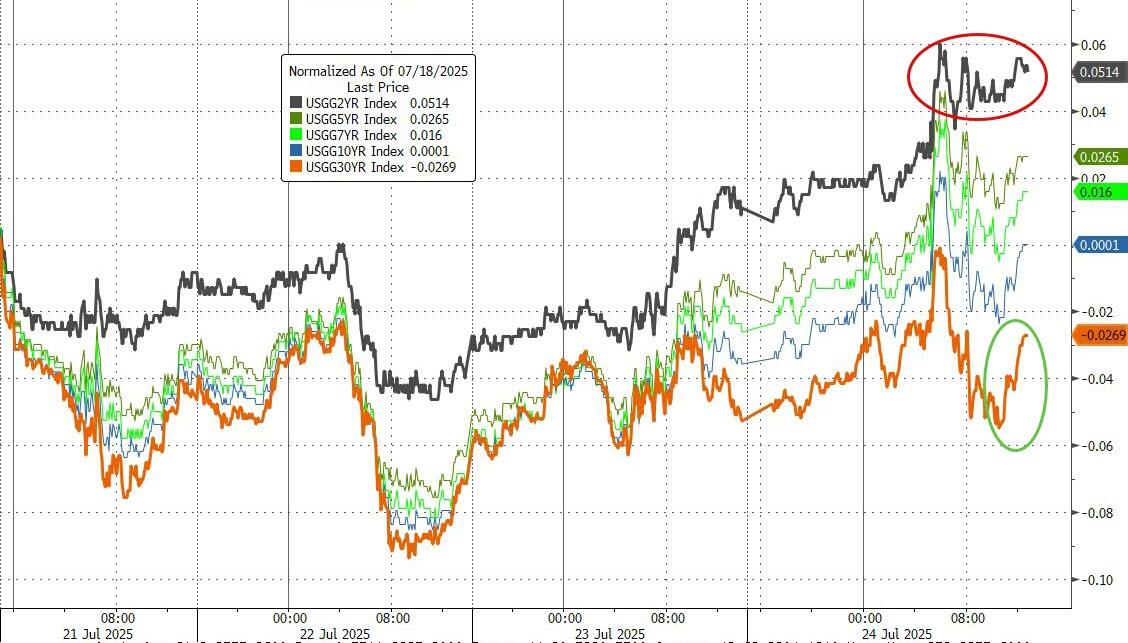
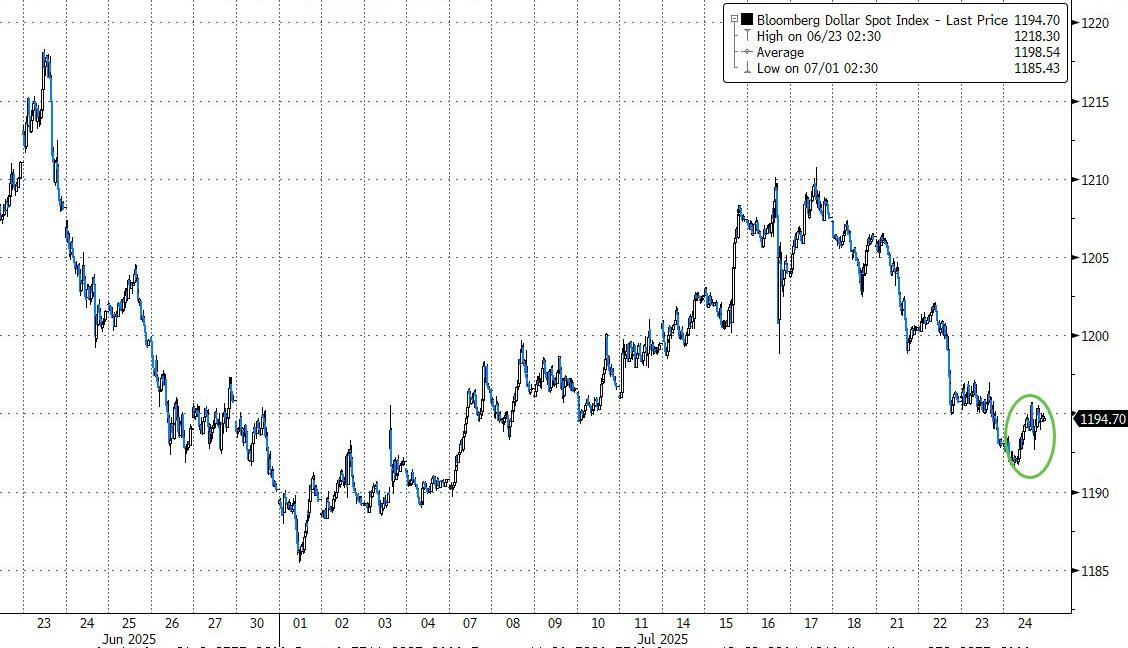
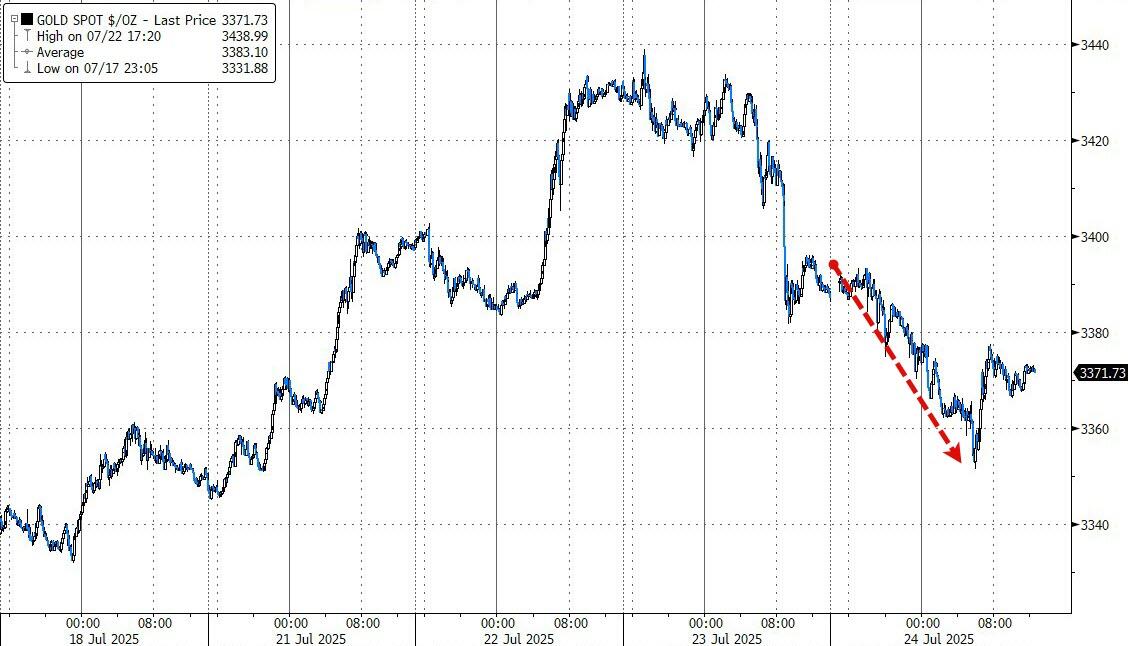
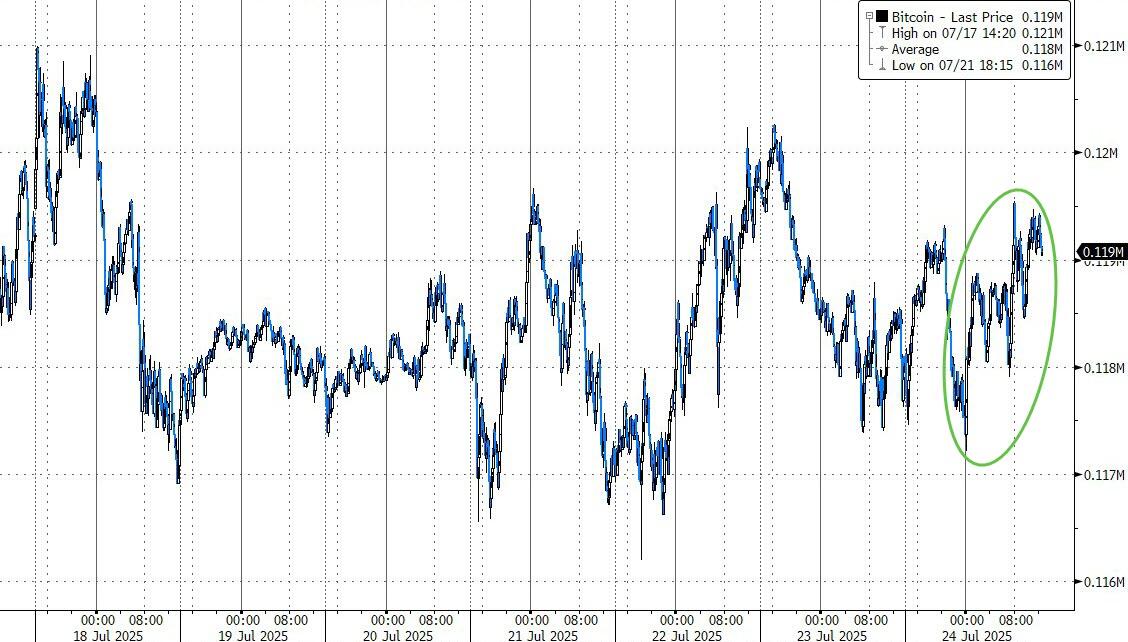
For the week, bond yields were mixed, the dollar regained some ground, gold slid for the third day in a row, and Bitcoin continued a two-week slide.
With so much going right for the bulls but that EU trade deadline still looming, I am pondering whether the good vibes will keep rolling—or could if the unresolved trade talks will trip up this rally?
Out of the 1,800+ ETFs out there, I only pick the ones that trade over $5 million per day (HV ETFs), so you don’t get stuck with a lemon that nobody wants to buy or sell.
Trend Tracking Indexes (TTIs)
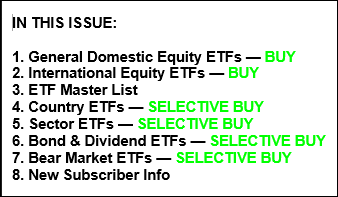
These are the main indicators that tell you when to buy or sell Domestic and International ETFs (section 1 and 2). They do that by comparing their position to their long-term M/A (Moving Average). If they cross above, and stay there, it’s a green light to buy. If they fall below, and keep going, it’s a red light to sell. And to make sure you don’t lose your shirt if things go south, I also use a 12% trailing stop loss on all positions in these categories.
All other investment areas don’t have a TTI and should be traded based on the position of each ETF relative to its own trend line (%M/A). That’s why I call them “Selective Buy.” In other words, if an ETF goes above its own trend line, you can buy it. But don’t forget to use a trailing sell stop of 12%, or less if you’re feeling nervous.
If some of these words sound like Greek to you, please check out the Glossary of Terms and new subscriber information in section 9.
DOMESTIC EQUITY ETFs: BUY— effective 5/20/2025
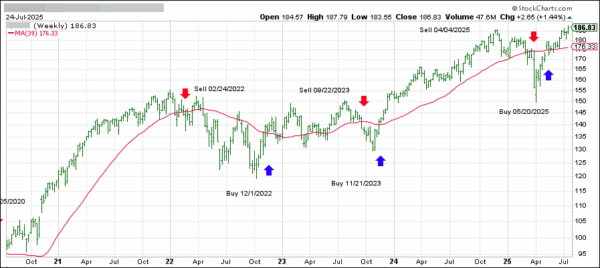
Click on chart to enlarge
This is our main compass, the Domestic Trend Tracking Index (TTI-green line in the above chart). It has broken above its long-term trend line (red) by +6.12% and remains in “Buy” mode, with our new holdings being subject to our trailing sell stops.
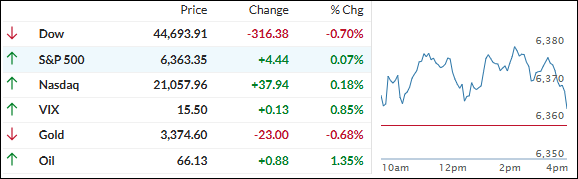
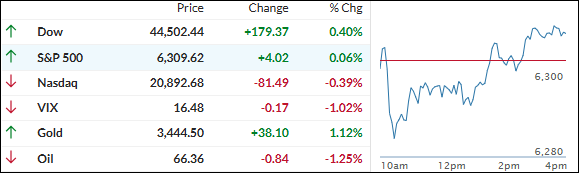
It was a turnaround kind of day for the markets. The S&P 500 and Nasdaq started strong—both riding early gains—while the Dow lagged, dragged down by IBM’s 10% tumble after missing revenue targets.
Big moves from the tech giants shaped the action: Alphabet popped 2% after beating Q2 revenue estimates, giving a boost to both the S&P and Nasdaq. Tesla, on the other hand, dropped 7% as auto sales disappointed for the second quarter in a row, putting a lid on broader index gains.
Traders also kept one eye on the ongoing standoff between Trump and the Fed. With Trump set to visit the Fed tomorrow, the tension is ramping up, especially as he keeps the pressure on Chairman Powell.
Helping sentiment this morning was a Financial Times report—confirmed by Bloomberg—that the U.S. is nearing a trade deal with the EU, which could see tariffs on imports climb to 15%.
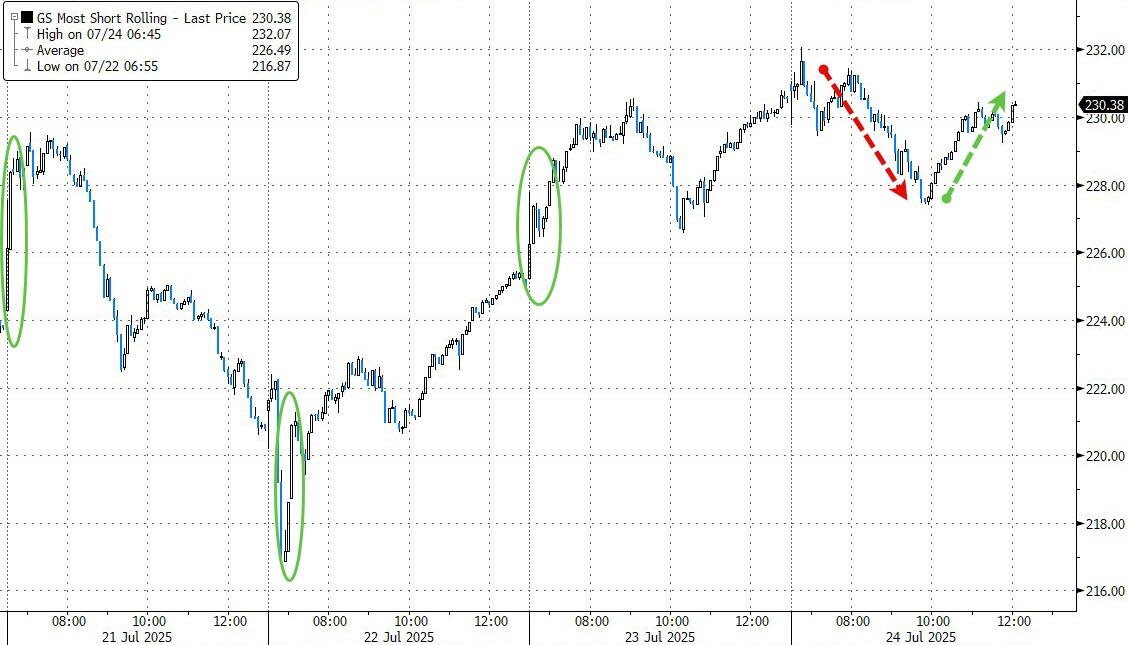
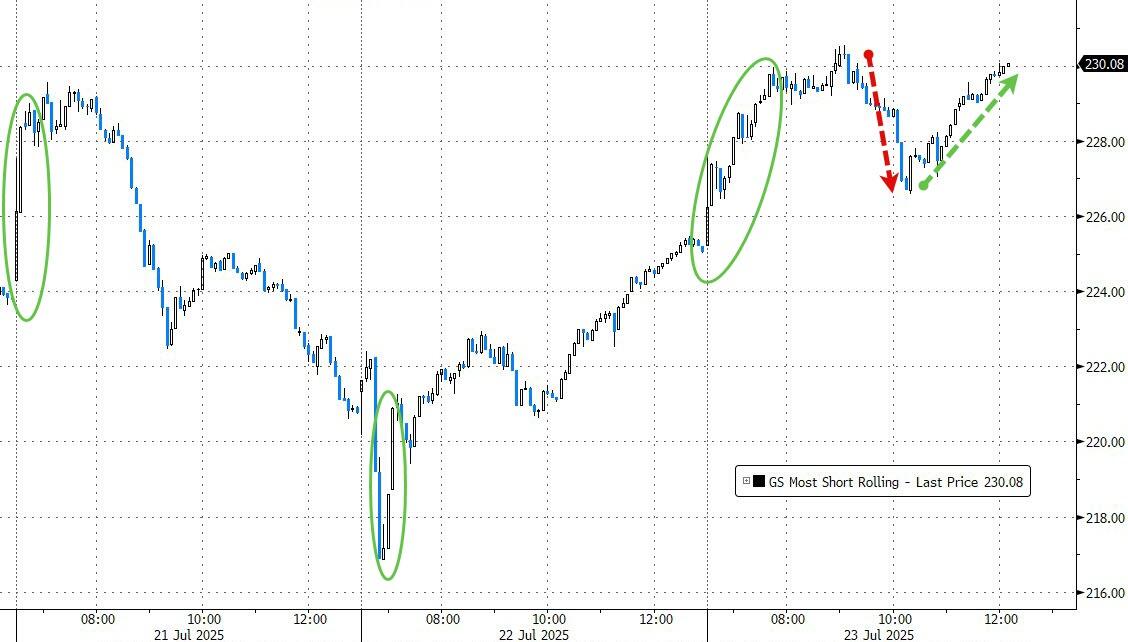
As the day wore on, enthusiasm fizzled. A midday short squeeze gave the indexes a quick lift, but only the S&P 500 and Nasdaq managed to eke out slim gains.
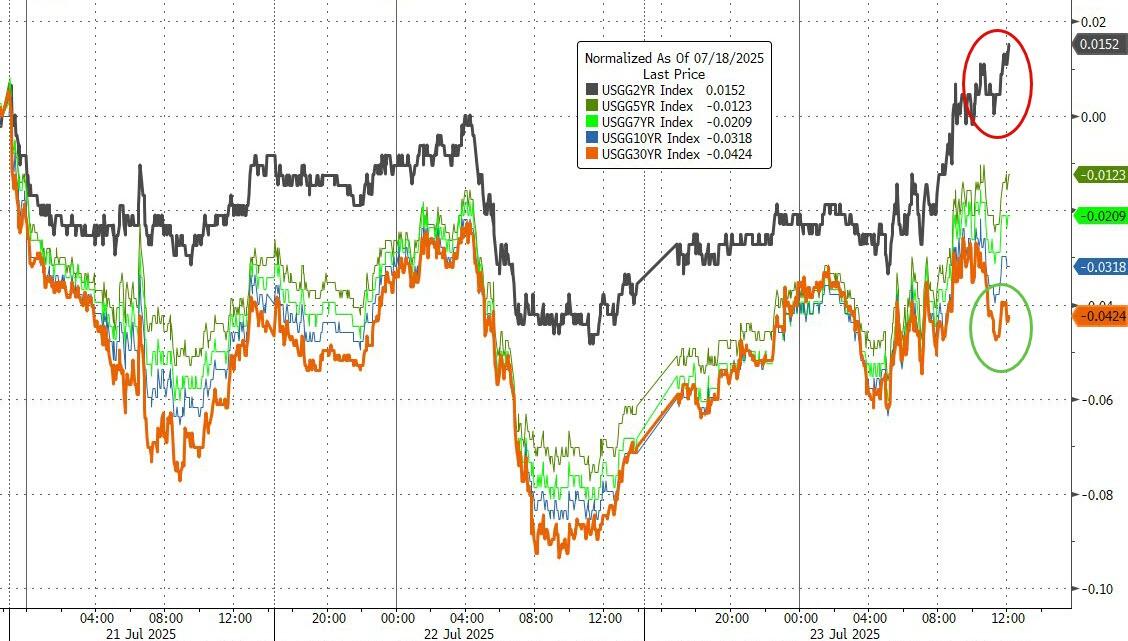
Small caps lagged, and bond yields rose—giving the dollar a modest bump but dragging gold prices lower. Meanwhile, Bitcoin bounced back after a rough overnight stretch.
All in all, it was a session stuck in uncertainty, with the market treading water once the closing bell rang.
With earnings season heating up, Fed drama brewing, and global trade talks hanging in the balance, will markets finally break out of this holding pattern—or are we in for more sideways churn?
Stocks got a jolt this morning after President Trump announced a trade deal with Japan, sending the Dow up more than 200 points out of the gate.
Hopes are running high that this “massive” agreement, which introduces a 15% tariff on Japanese goods instead of the 25% that was originally on the table, could spark even more deals down the road. Trump also mentioned ongoing talks with the EU, aiming for another breakthrough before the August 1 deadline.
The S&P 500 followed the Dow’s lead, but the Nasdaq took its time, barely moving until it finally got a lift later in the session.
All eyes are now on Alphabet and Tesla, with both set to report earnings after the closing bell. As the first of the mega-cap techs to release results, their numbers could set the tone for the rest of earnings season.
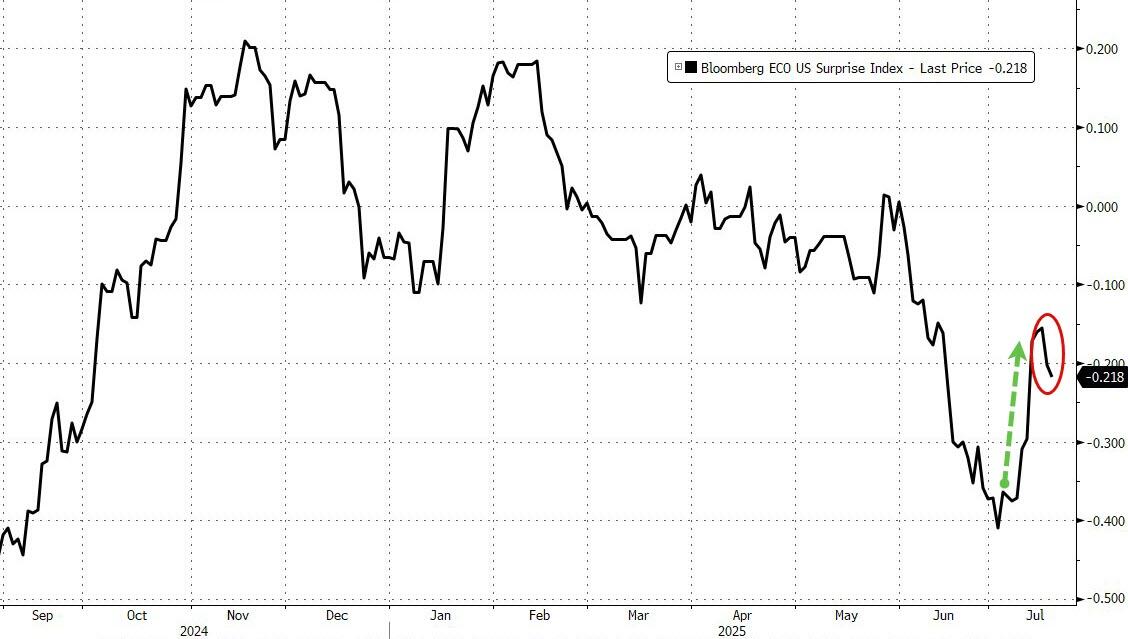
Elsewhere, market sentiment brightened thanks to the Japan deal, even though U.S. existing home sales fell short of expectations and took some wind out of the macro surprise index.
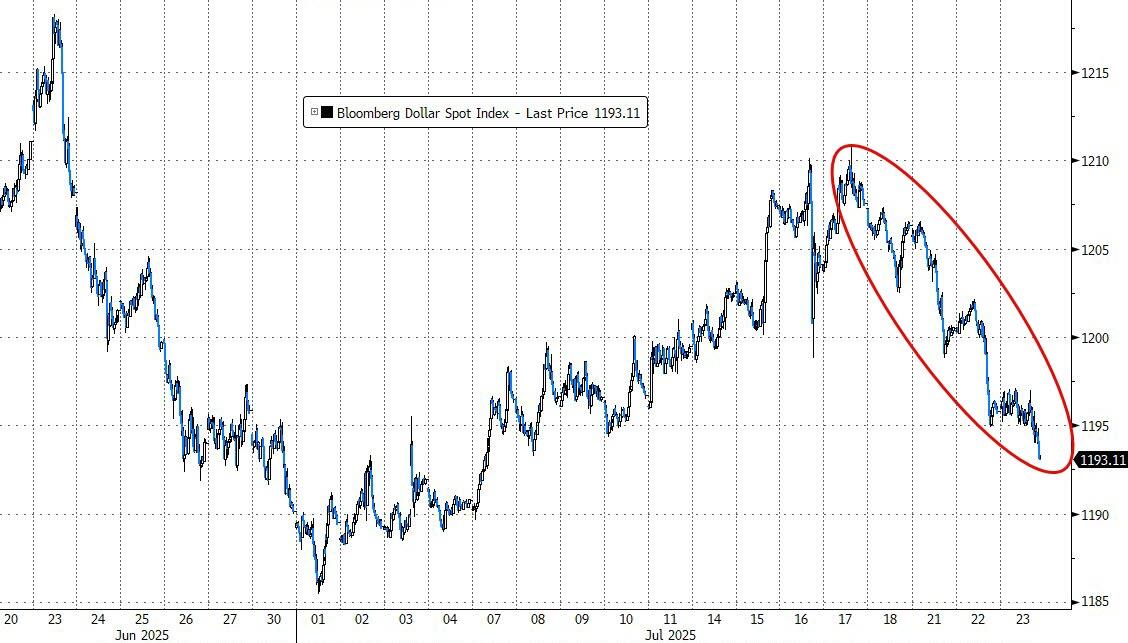
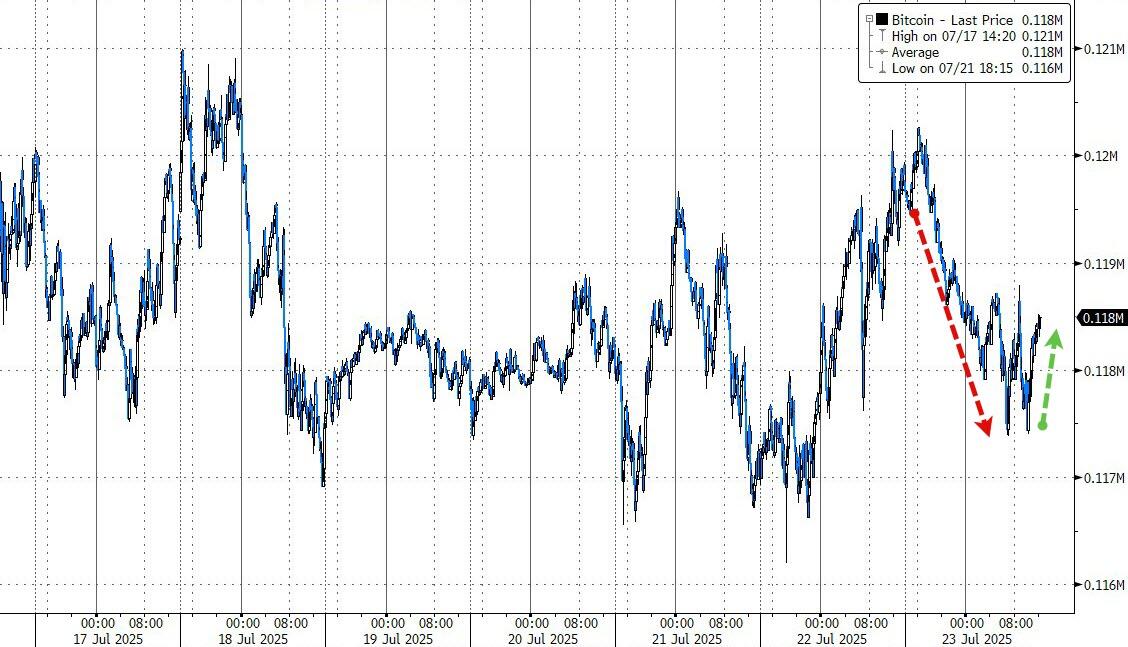
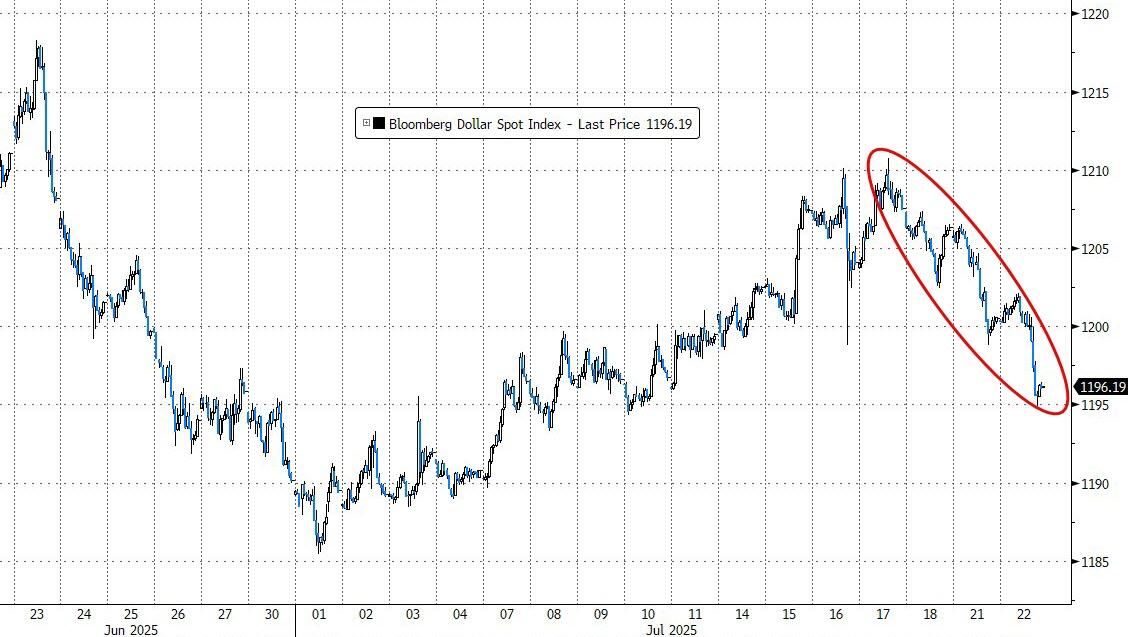
The dollar continued to slide, but that didn’t give a boost to gold this time, which ended the day lower. Bitcoin dipped but found its footing at around $118,000.
With so much riding on the next big earnings reports, will tomorrow’s market direction hinge on how Alphabet and Tesla perform after the bell?
Today’s market did a complete 180 from yesterday. Early optimism fizzled fast for the tech sector, dragging the Nasdaq lower, while the Dow held strong and managed to notch a gain by the closing bell.
The main culprit? Chip stocks took a hit, with both Nvidia and Broadcom sliding by almost 3%—fallout from a Wall Street Journal report that a colossal $500 billion AI project is facing serious delays and is scaling back its ambitions for now.
Earnings painted a mixed picture. NXP Semiconductors posted results that let down investors, sending the stock 1% lower. Over in aerospace and defense, Lockheed Martin stumbled a hefty 5% after revealing big program losses and slashing its profit forecast for the year.
Tobacco giant Philip Morris also slipped, dropping 7% despite beating earnings estimates, as traders focused on missed revenue targets and forward guidance.
With so many crosscurrents, traders are now glued to management commentary about macro uncertainty, tariffs, and, of course, what’s next for AI—a theme that’s moving both markets and stock prices with every headline.
By day’s end, only the Dow stayed green. The S&P 500 flatlined, and the Nasdaq stayed down for the count.
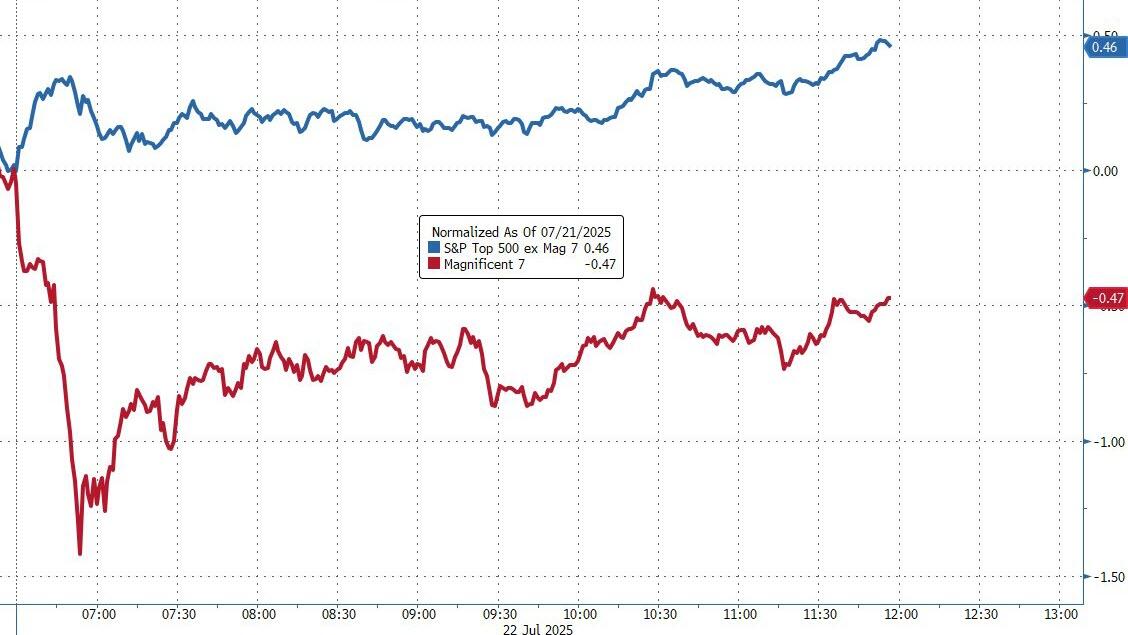
The much-watched Mag 7 basket of mega-cap techs underperformed the other S&P 500 names, breaking its recent streak of dominance.
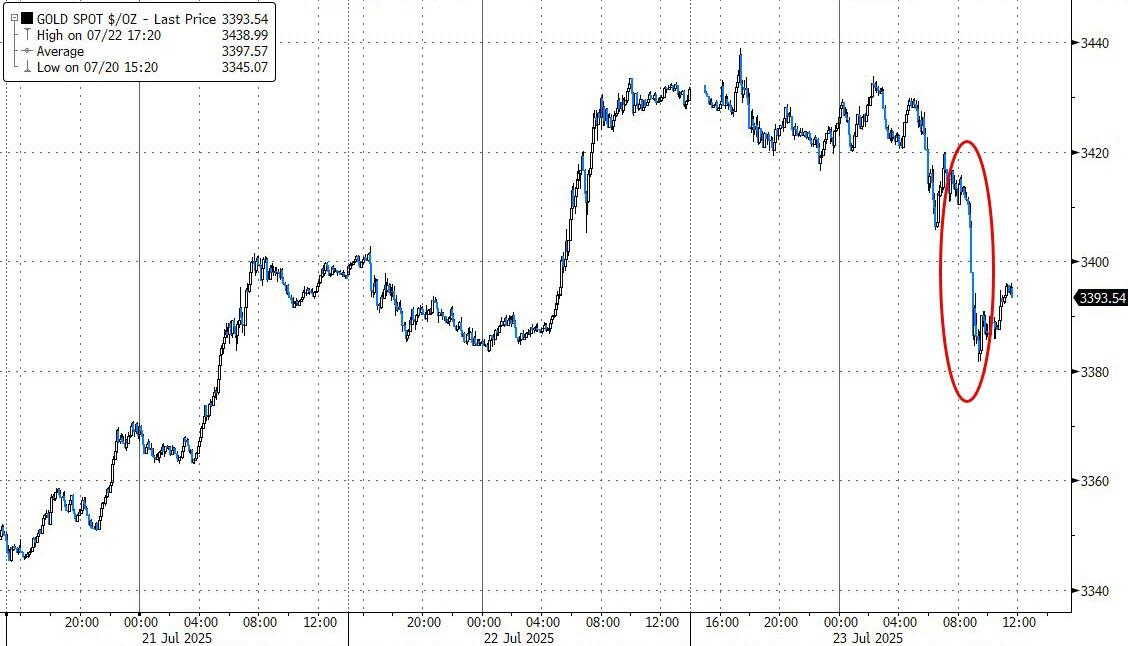
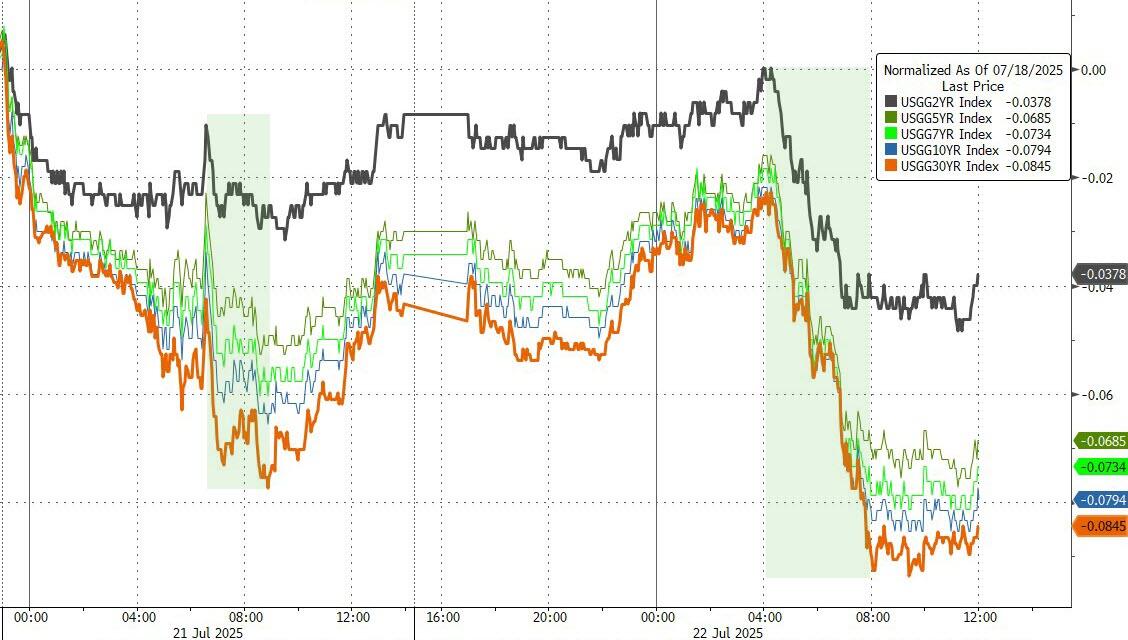
Bond yields drifted lower, offering some support for stocks, while the dollar continued its losing streak. Gold bucked the broader action, charging above $3,400 for a solid daily win.
Meanwhile, Bitcoin bounced around but managed to rally past $120,000 before the end of the U.S. session—keeping its curious pattern of lagging global liquidity by about three months alive.
So, with everything swirling—AI delays, chip jitters, and macro worries—will the “risk-on” mood come roaring back, or are we in for more surprises as earnings season rolls on? And for crypto watchers: Is the long-awaited $200,000 Bitcoin within reach this cycle?
