Relief Rally Or False Start? Stocks Rebound As Risks Linger

Ulli Market Commentary Contact

[Chart courtesy of MarketWatch.com]

  1. Moving the market

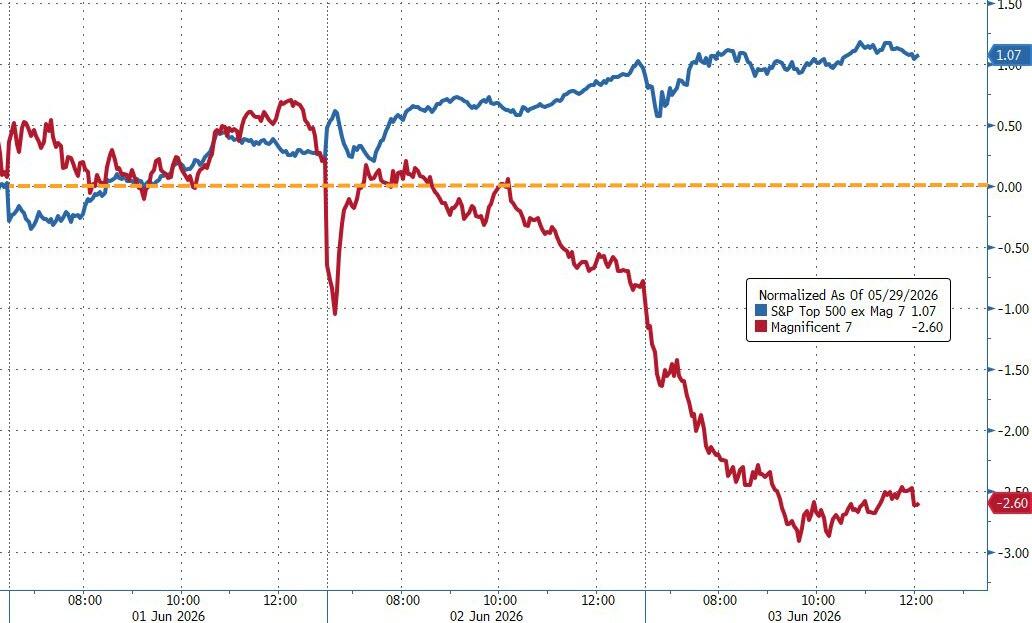
Stocks started the day on a stronger footing, with chip names leading the rebound after Friday’s brutal sell-off. Traders seemed eager to step back in, hoping the recent weakness was just a reset rather than the start of something bigger.

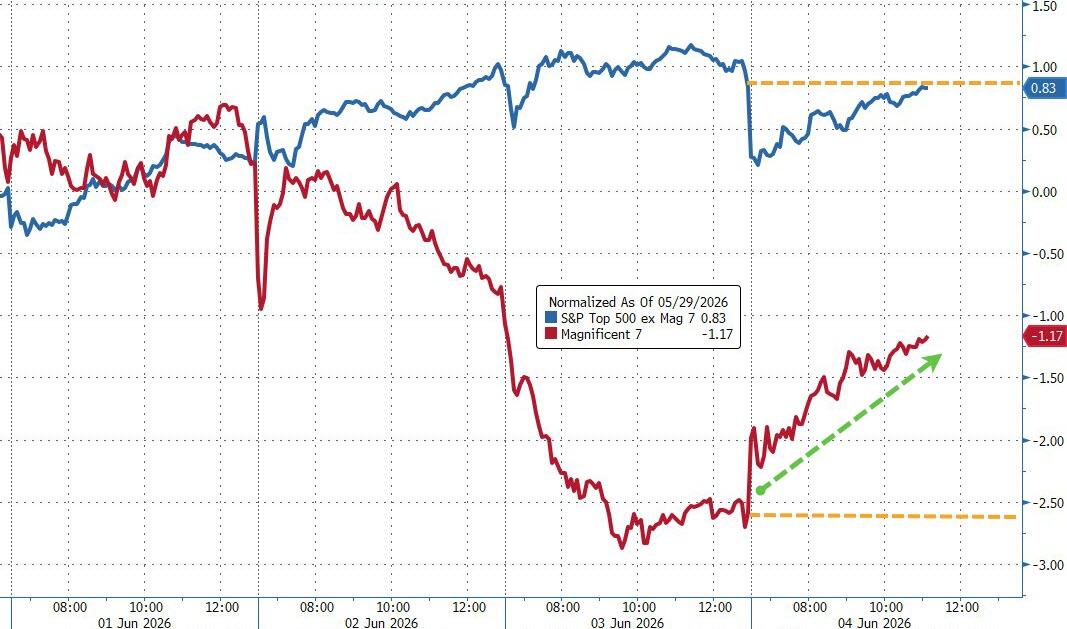
Micron, which has been a key driver of this latest bull run, jumped nearly 10% after getting hit hard on Friday. Nvidia and Broadcom also bounced back, helping lift sentiment across the tech space.

But the backdrop remains anything but calm. Fresh strikes by Iran over the weekend raised new concerns about whether the already fragile ceasefire can hold. The situation escalated after Iranian Parliament Speaker Ghalibaf accused the U.S. of violating agreements, pointing to actions like the naval blockade.

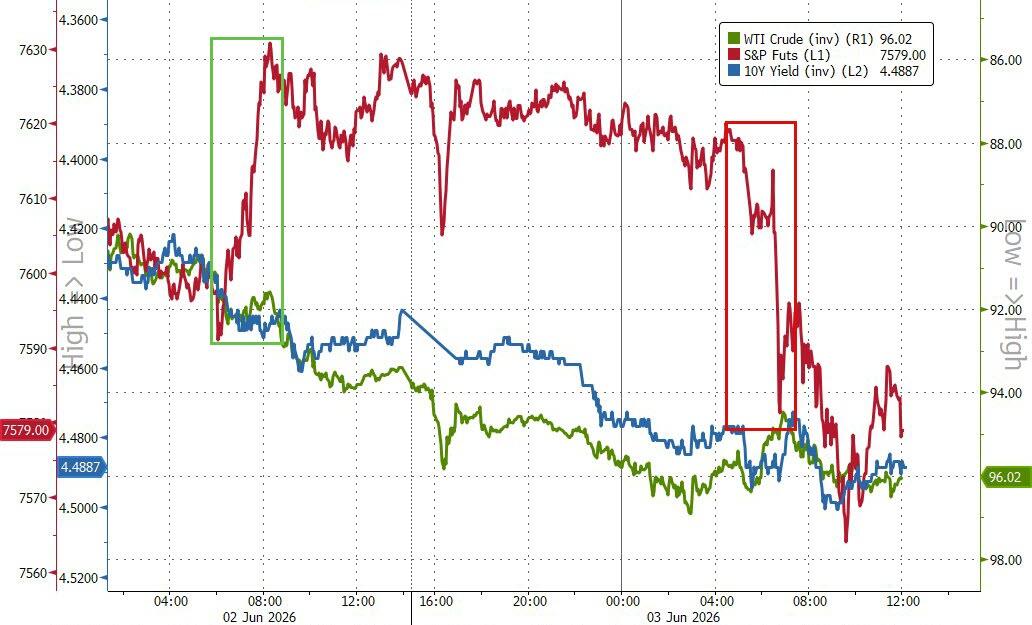
Tensions kept energy markets on edge. Oil prices moved higher after Israel launched what it described as a “large-scale strike on strategic defense systems” in response to Iranian attacks.

Despite the back-and-forth, President Trump said both sides are still pushing toward an immediate ceasefire and urged them to halt hostilities altogether.

Meanwhile, one analyst pointed out that the market might be running into a different kind of problem—its own success. After a strong comeback, lingering inflation risks are still hanging over investors’ heads and could limit how far this rally can go.

Looking ahead, it’s shaping up to be a big week. Inflation data will be front and center, along with the highly anticipated public debut of Elon Musk’s SpaceX. It’s expected to be one of the largest IPOs ever and could serve as a major test for the current AI-driven market optimism.

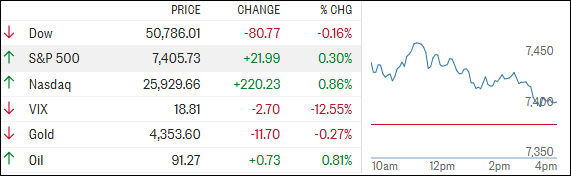
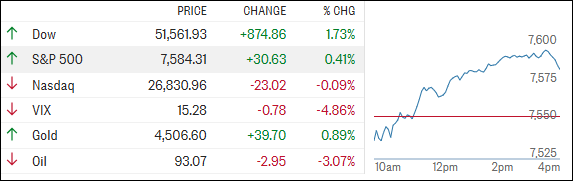
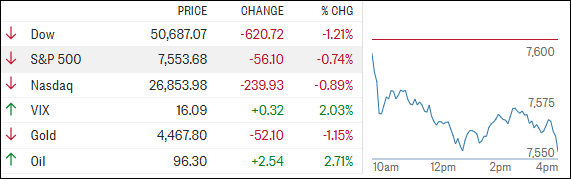
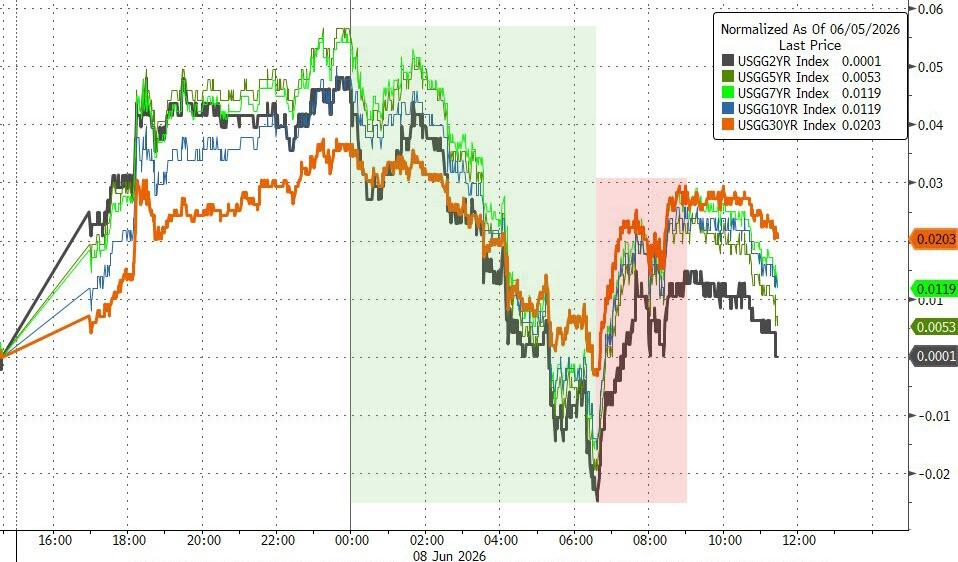
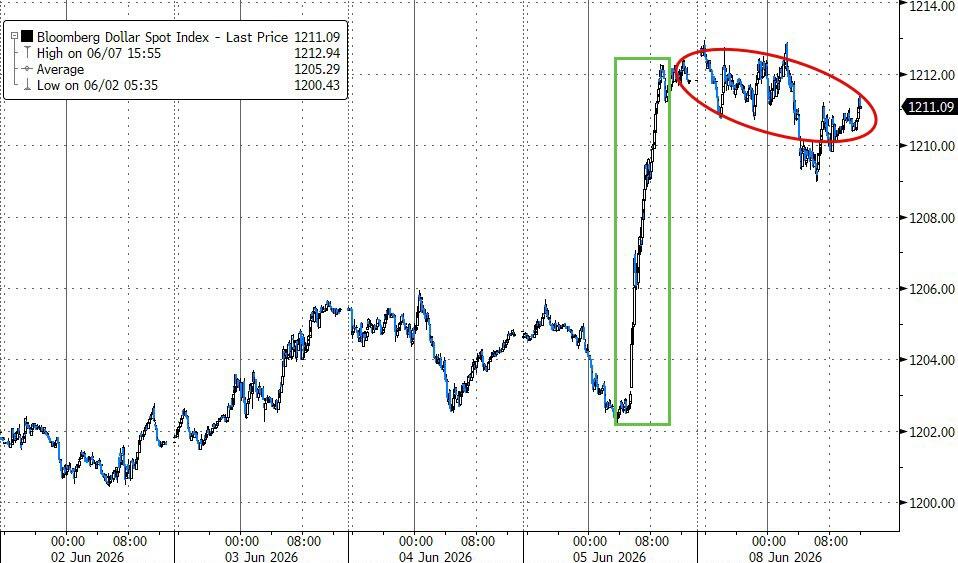
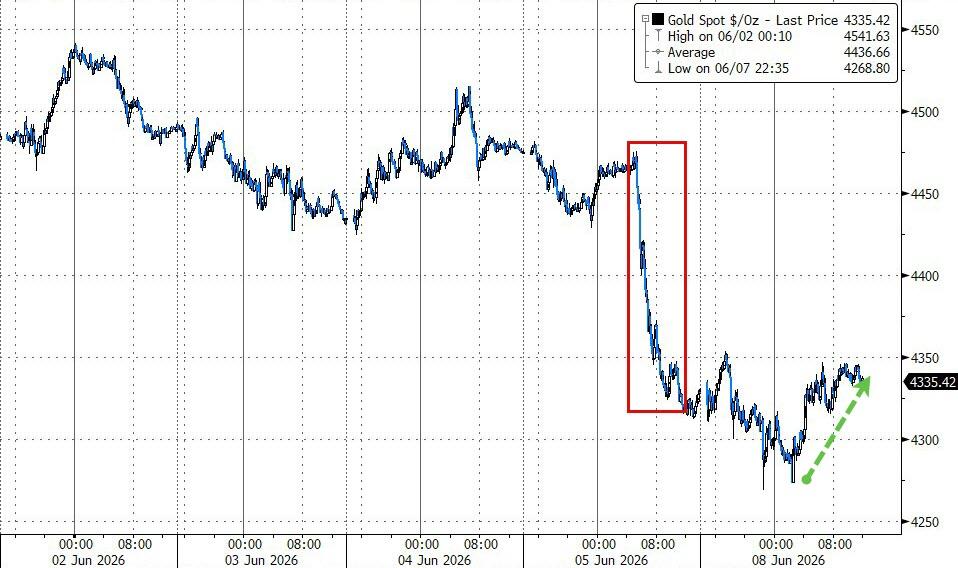
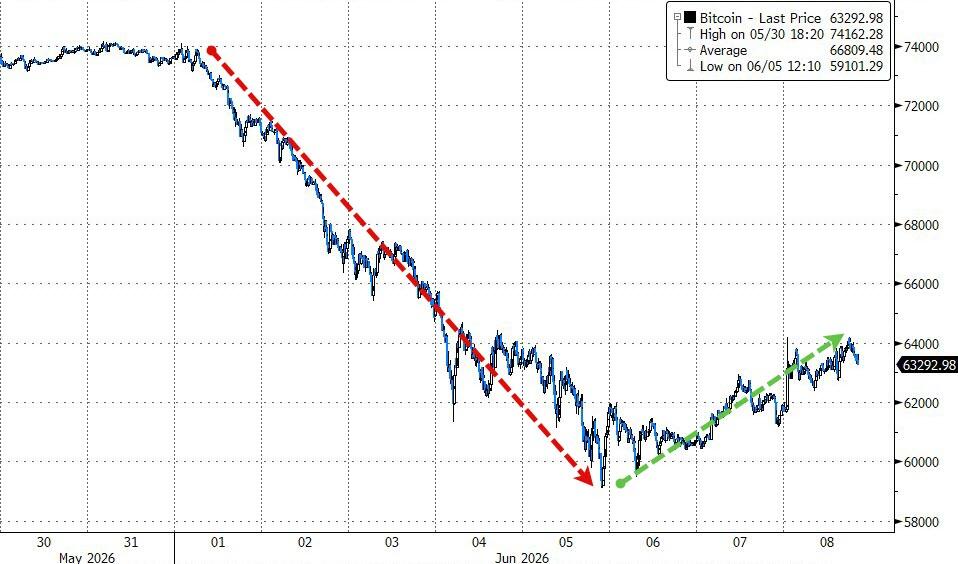
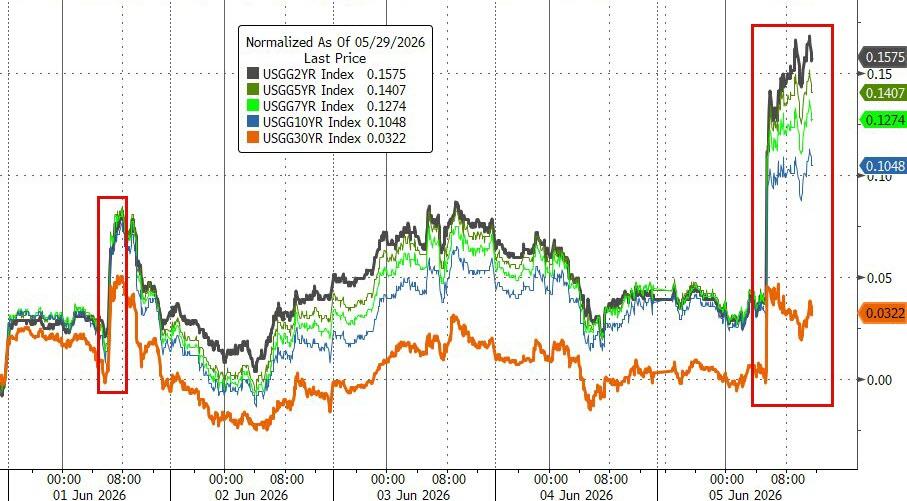
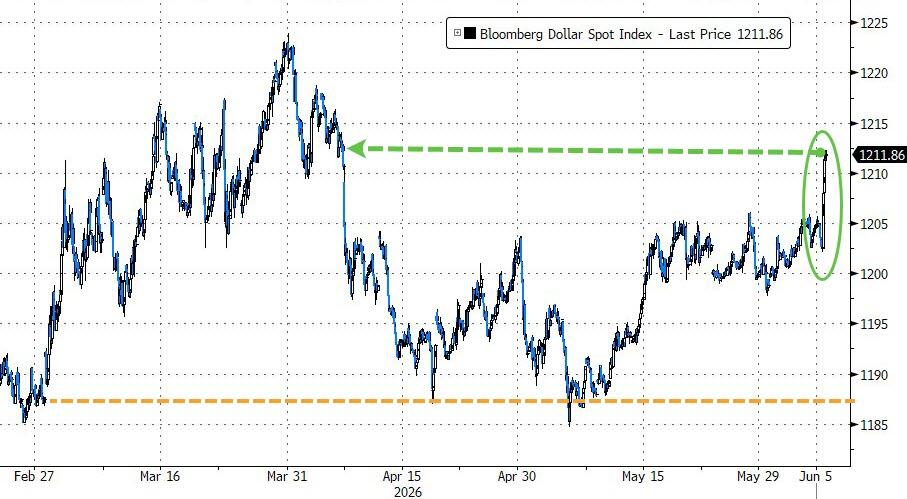
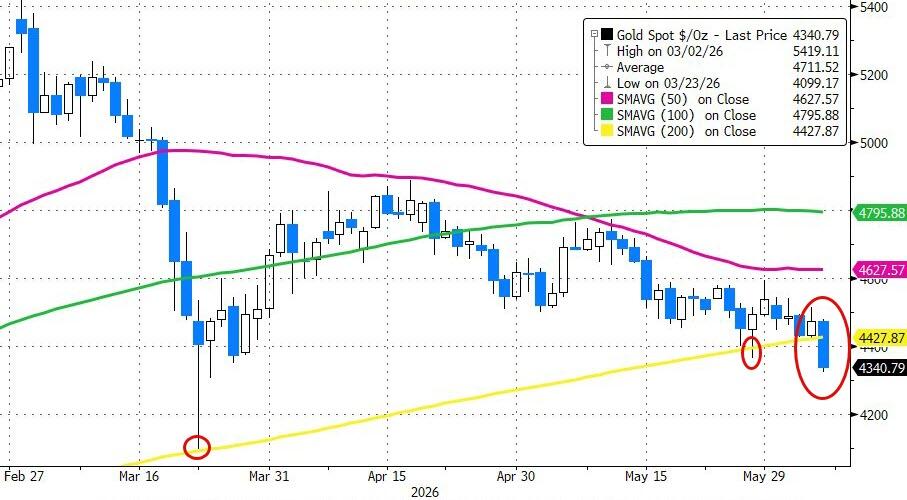
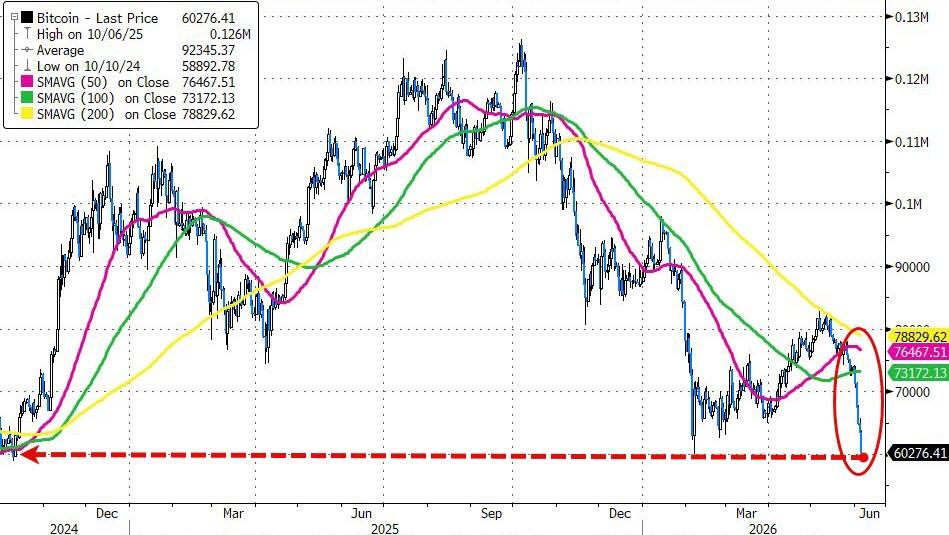
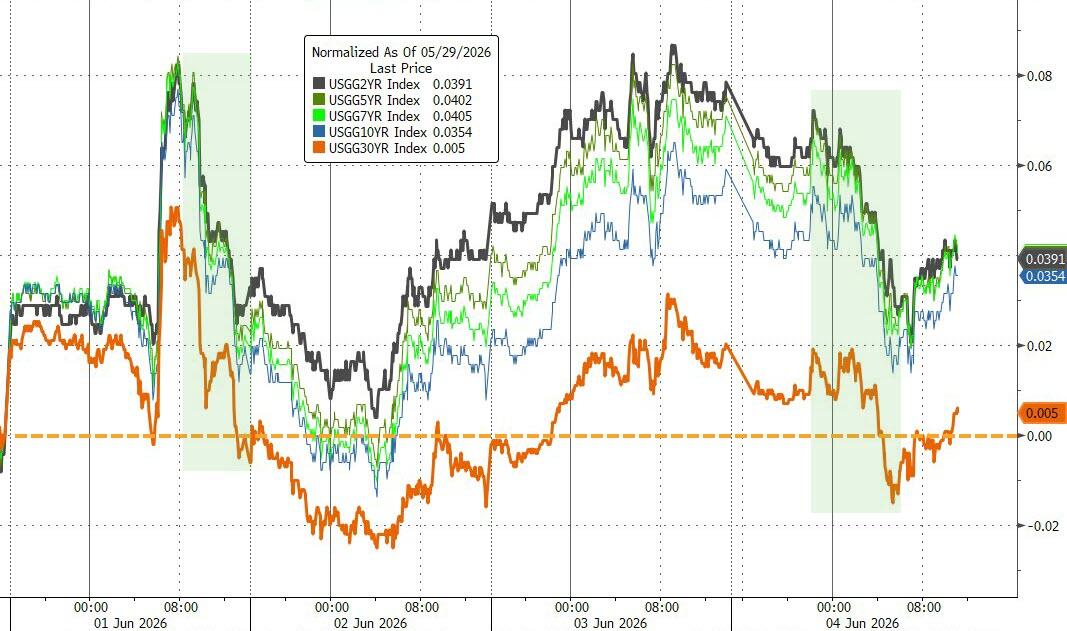
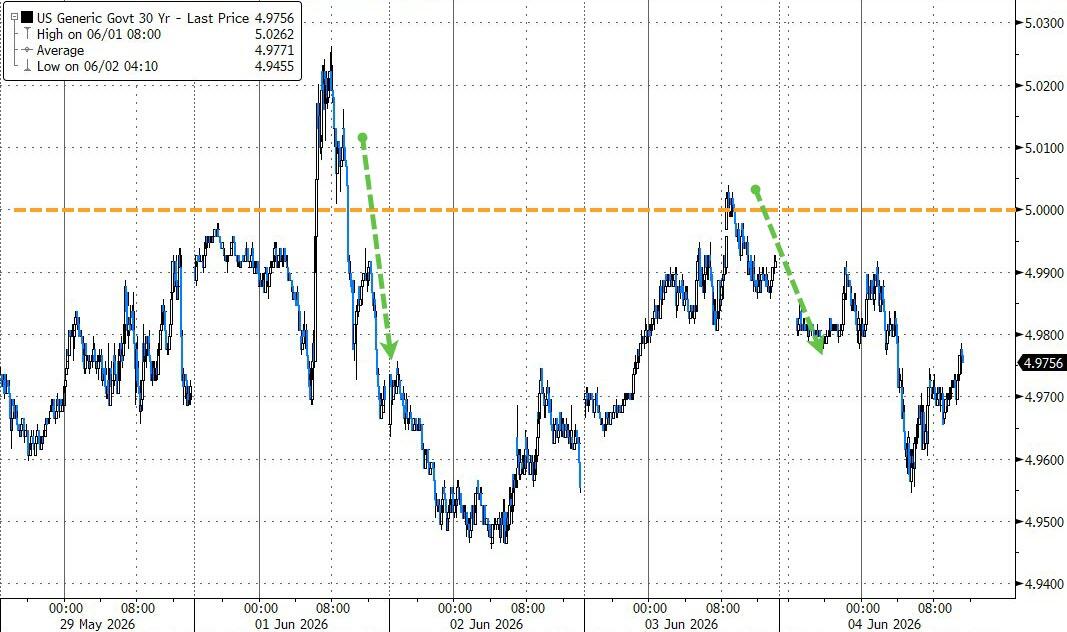
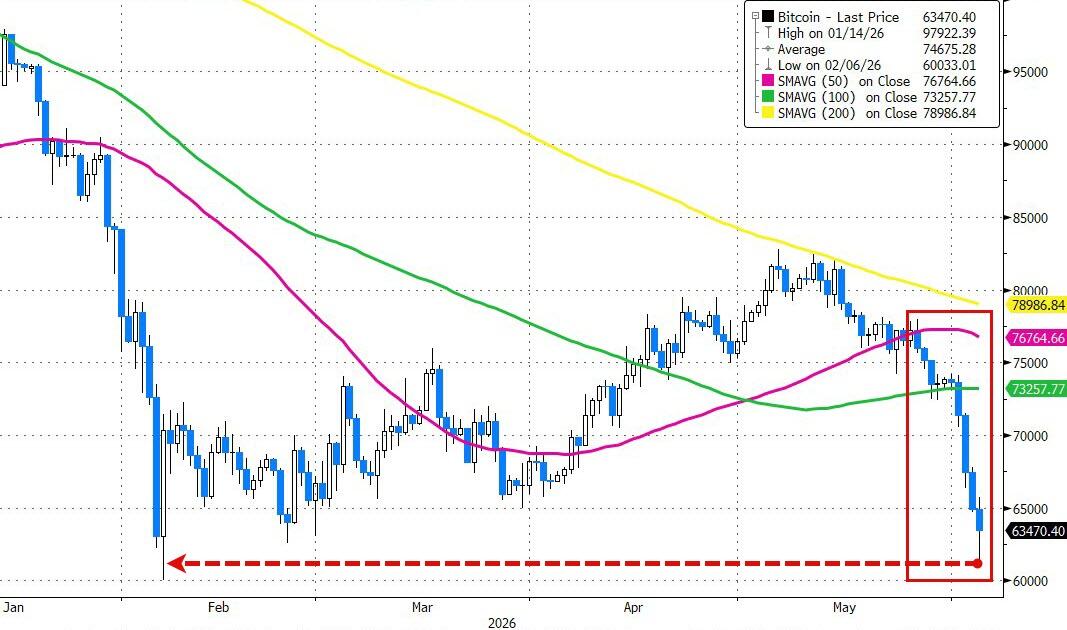
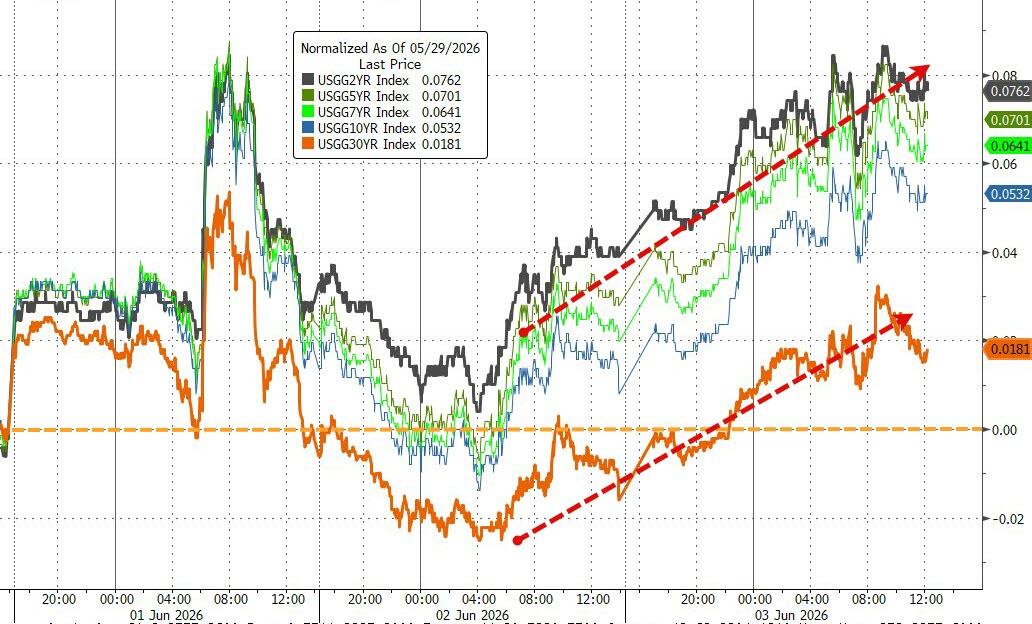
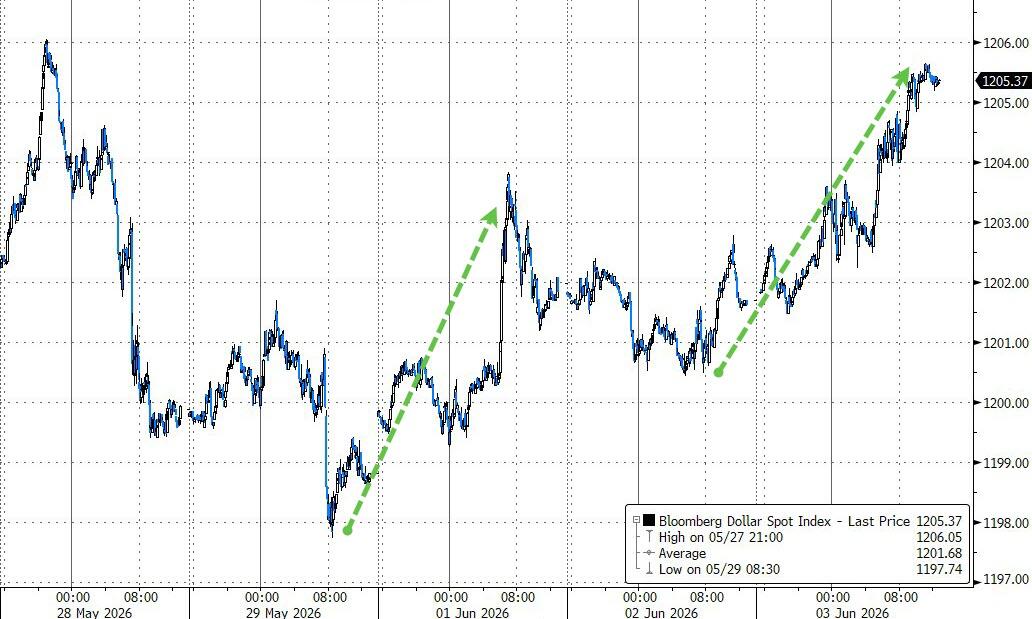
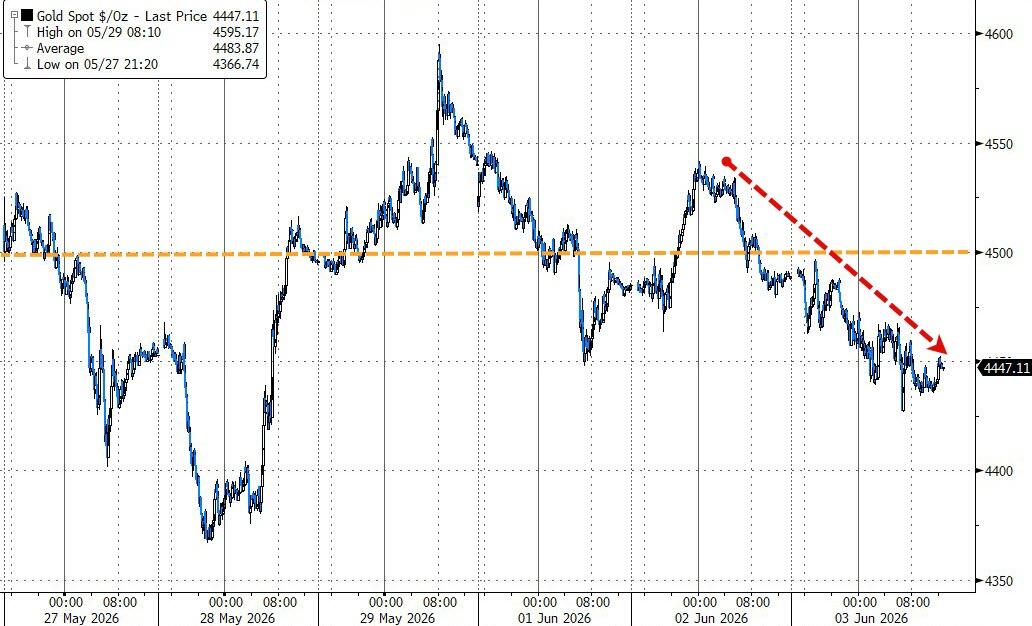
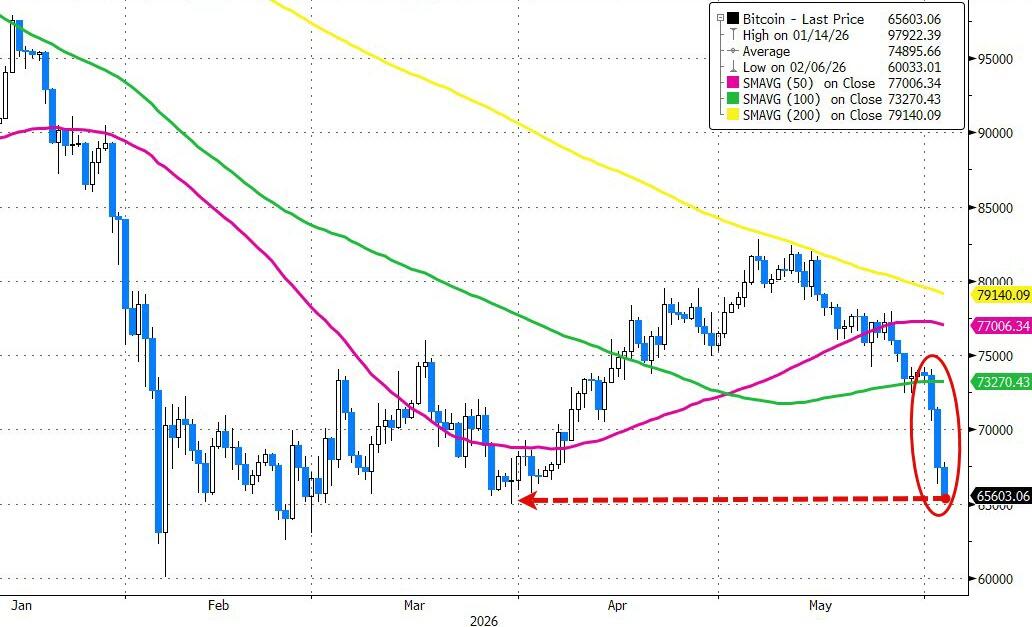
By the close, the S&P 500 and Nasdaq managed to recover a portion of Friday’s losses—more of a relief rally than a full recovery. Bond yields ticked higher, while the dollar slipped slightly, giving gold a lift after an earlier dip. Bitcoin also bounced back, testing the $64K level.

So now the big question: was this just a classic dead-cat bounce, or the start of a more durable move higher?

Read More

ETFs On The Cutline – Updated Through 06/05/2026

Ulli ETFs on the Cutline Contact

Do you want to know which ETFs are hot and which ones are not? Then you need my High-Volume ETF Cutline report. It tells you how close or far each of the 311 ETFs I follow is from its long-term trend line (39-week SMA). These are the ETFs that trade more than $5 million a day, so they are not some obscure funds that nobody cares about.

The report is split into two parts: The winners that are above their trend line (%M/A), and the losers that are below it. The yellow line is the line of shame that separates them. You can see how many ETFs are in each group and how they have changed since the last report (231 vs. 208 current).

Take a peek:

The HV ETF Master Cutline Report

If you are confused by some of the terms we use, don’t panic. I have a helpful Glossary of Terms for you.

If you want to learn more about the Cutline method and how it can make you rich (or at least less poor), read my original post here.

ETF Tracker Newsletter For June 5, 2026

Ulli ETF Tracker Contact

ETF Tracker StatSheet          

You can view the latest version here.

STRONG JOBS, WEAK MARKETS: WHEN GOOD NEWS TURNS BAD

[Chart courtesy of MarketWatch.com]

  1. Moving the market

Stocks got off to a rough start, with the S&P 500 and Nasdaq sliding early as chip stocks came under pressure and Treasury yields moved higher.

The big reason? A much stronger-than-expected jobs report that rattled the market.

Semiconductor names led the decline. Broadcom dropped about 3% after already tumbling more than 12% the day before. Marvell sank over 8%, and Micron wasn’t far behind, down around 6%.

The catalyst was May’s jobs report, which showed payrolls jumping by 172,000—more than double what economists were expecting. Meanwhile, the unemployment rate held steady at 4.3%, right in line with forecasts.

That kind of strength in the labor market pushed Treasury yields higher, as traders started to rethink the Fed’s next move. The 10-year yield climbed above 4.5%, and the 30-year moved past 5%.

At this point, the narrative is clearly shifting. The conversation is no longer “when will the Fed cut rates?” but rather “why haven’t they hiked again yet?” If the Fed does pivot from a more dovish stance to a hawkish one, that’s a big adjustment—and markets typically don’t handle those transitions smoothly.

In classic fashion, good news turned into bad news. Strong jobs data sent rate hike expectations soaring, and nearly every asset class moved lower. Even falling oil prices couldn’t stop the broad-based sell-off.

It turned into a tough stretch overall. The Nasdaq just logged its worst day and week since April 2025, while the S&P 500 saw its historic winning streak come to an end. Even the “Mag 7” lagged the broader market.

Elsewhere, bond yields surged, the dollar ripped higher, and gold broke below its 200-day moving average, wiping out its gains for the year. The rest of the metals complex followed suit, with silver taking the hardest hit.

Crypto didn’t escape either—Bitcoin slid along with everything else, barely holding support around the $60K level.

While the AI-driven rally has been a major force behind this bull market, it cuts both ways.

When momentum shifts and leverage unwinds, pullbacks can get sharp in a hurry—and that’s exactly the kind of environment we could be heading into.

So, the big question now is: are markets just taking a breather, or is this the start of a deeper reset as rates push higher?

Read More

Weekly StatSheet For The ETF Tracker Newsletter – Updated Through 06/04/2026

Ulli ETF StatSheet Contact

ETF Data updated through Thursday, June 4, 2026

How to use this StatSheet:

  1. Out of the 1,800+ ETFs out there, I only pick the ones that trade over $5 million per day (HV ETFs), so you don’t get stuck with a lemon that nobody wants to buy or sell.
  1. Trend Tracking Indexes (TTIs)

These are the main indicators that tell you when to buy or sell Domestic and International ETFs (section 1 and 2). They do that by comparing their position to their long-term M/A (Moving Average). If they cross above, and stay there, it’s a green light to buy. If they fall below, and keep going, it’s a red light to sell. And to make sure you don’t lose your shirt if things go south, I also use a 12% trailing stop loss on all positions in these categories.

  1. All other investment areas don’t have a TTI and should be traded based on the position of each ETF relative to its own trend line (%M/A). That’s why I call them “Selective Buy.” In other words, if an ETF goes above its own trend line, you can buy it. But don’t forget to use a trailing sell stop of 12%, or less if you’re feeling nervous.

If some of these words sound like Greek to you, please check out the Glossary of Terms and new subscriber information in section 9.

  1. DOMESTIC EQUITY ETFs: BUY— effective 5/20/2025

Click on chart to enlarge

This is our main compass, the Domestic Trend Tracking Index (TTI-green line in the above chart). It has broken above its long-term trend line (red) by +8.55% and remains in “Buy” mode, with our holdings being subject to our trailing sell stops.

Read More

Dow Hits Record High As Tech Stumbles In Sharp Sector Rotation

Ulli Market Commentary Contact

[Chart courtesy of MarketWatch.com]

  1. Moving the market

The Dow kept the momentum going this morning, pushing to a fresh record high, while the Nasdaq headed the opposite way as traders rotated out of chip stocks and into more traditional, non-tech names.

Leading the charge for the Dow was UnitedHealth, which jumped 5.8%. JPMorgan Chase and Walmart also helped lift the index, gaining 2.2% and 1.6%. Outside the Dow, “old economy” names like Costco and Eli Lilly had a strong showing too, climbing 2% and 4.6%.

The shift seemed to start with a sharp sell-off in Broadcom, which dropped 14% after missing fiscal second-quarter revenue expectations. That move spilled over into the broader AI space, prompting traders to dial back exposure. CrowdStrike added to the pressure, falling 10% after issuing underwhelming revenue guidance.

All of this came on the heels of a rough session yesterday, with markets already on edge due to escalating tensions in the Middle East following increased clashes between the U.S. and Iran.

By the close, the Nasdaq managed to claw its way back to around flat, but still notched its biggest relative underperformance versus the Dow in 17 months—a pretty clear sign that money is shifting around under the surface.

On the macro side, falling oil prices, easing bond yields, and a softer dollar gave gold some breathing room, helping it rebound moderately.

At the same time, rising jobless claims and a spike in announced job cuts added a layer of concern ahead of tomorrow’s payroll report, highlighting the growing disconnect between “soft” survey data and more reality-based “hard” numbers.

Interestingly, while the Magnificent 7 outperformed the rest of the S&P 500 today, they’re still lagging significantly on the week.

Bond yields continued to drift lower, with the 30-year pulling back after testing 5% yesterday, dragging the dollar down with it. Gold briefly surged back above $4,500, while Bitcoin dipped near $61K before bouncing slightly.

One analyst pointed out that positioning between risk-on and risk-off assets is now at its most extreme since 2019—which raises a big question: how long can this balancing act last before something gives?

Read More

Markets Pull Back As Oil, Yields, And Geopolitics Rattle Confidence

Ulli Market Commentary Contact

[Chart courtesy of MarketWatch.com]

  1. Moving the market

Stocks came under pressure right out of the gate as rising oil prices and climbing Treasury yields rattled investors.

The concern? Ongoing tensions between the U.S. and Iran could keep inflation elevated for longer than expected. Oil moved higher after both countries launched new strikes, with Kuwait reporting overnight that its air defense systems were intercepting “hostile targets.”

Adding to the drag, AI-related names—recent market darlings—took a breather. Nvidia slipped more than 2%, while Dell and Oracle dropped about 5.5%. Microsoft wasn’t spared either, losing around 2%. After such a strong run fueled by optimism and heavy investment in the AI cycle, a pause here isn’t all that surprising.

In fact, the timing makes sense. We’re moving past earnings season, which has been a major tailwind, so a bit of cooling off—or even some added volatility—feels natural as we head into the quieter summer months.

On the economic front, things are a bit mixed. Strong ADP jobs data and solid Services PMI pushed the U.S. Macro Surprise Index to its highest level since September 2023.

Normally that would lift sentiment, but instead it seemed to confuse traders. Yesterday’s bullish momentum quickly gave way to today’s reality of rising oil prices and higher bond yields.

The S&P 500’s 9-day winning streak came to an end, with all major indexes closing lower. Small caps led the decline, while the S&P held up relatively well. The “Mag 7” continues to struggle this week, significantly underperforming the broader S&P 493.

Elsewhere, bond yields spiked, and the dollar strengthened, putting pressure on gold, which slipped again. Bitcoin didn’t offer much refuge either, with sellers pushing it down toward key support levels as ETF outflows continue.

What we’re seeing looks like an extreme positioning shift—money chasing AI stocks while flowing out of gold and crypto, fueling pockets of speculation. The big question is: how long can that imbalance last before something gives?

Read More