
- Moving the markets
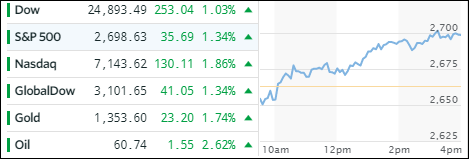
Sometimes you just have to laugh when you see the type of chaos in the markets that we saw today. The widely anticipated Consumer Price Index (CPI) reading came in much “hotter” than expected as it surged 0.5% in January. Consequently, bond yields spiked with the 10-year adding 8 basis points to close at 2.91%, which is its highest close since January 2014.
The US Dollar (UUP), which should have rallied given the yield surge, collapsed -0.77% while stocks rallied after an early morning dip pushing the major indexes solidly in the green. This outcome left many analysts scratching their heads as higher stocks, higher yields and a lower US dollar simply does not add up.
ZH summarized it best in what we learned during this session based on the reaction of various asset classes:
- Yields: many, many rate hikes
- Dollar: no rate hikes
- Stocks: hmmm, maybe some rate hikes
- Gold: we blew up the fed. No rate hikes.
Apparently, the new theme is that stocks love higher bond yields. Go figure…
The VIX hit and intra-day of 25 but closed below 20, while the Dow had a swing from the lows to the highs of some 600 points and today’s short-squeeze was the biggest in the past 12 months. These are all indications that equities can turn in either direction on a dime.
Nevertheless, the major trend remains bullish, and I will increase our ETF exposure slowly but surely while keeping my eyes firmly feasted on our exit strategy.
- ETFs in the Spotlight
In case you missed the announcement and description of this section, you can read it here again.
It features 10 broadly diversified and sector ETFs from my HighVolume list as posted every Saturday. Furthermore, they are screened for the lowest MaxDD% number meaning they have been showing better resistance to temporary sell offs than all others over the past year.
The below table simply demonstrates the magnitude with which some of the ETFs are fluctuating in regards to their positions above or below their respective individual trend lines (%M/A). A break below, represented by a negative number, shows weakness, while a break above, represented by a positive percentage, shows strength.
For hundreds of ETF choices, be sure to reference Thursday’s StatSheet.
Year to date, here’s how our candidates have fared so far:
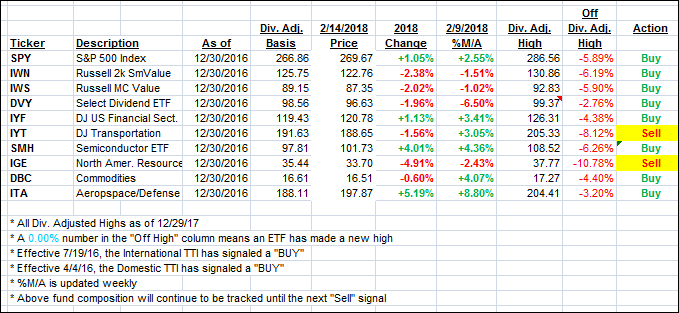
Again, the %M/A column above shows the position of the various ETFs in relation to their respective long term trend lines, while the trailing sell stops are being tracked in the “Off High” column. The “Action” column will signal a “Sell” once the -7.5% point has been taken out in the “Off High” column.
- Trend Tracking Indexes (TTIs)
Our Trend Tracking Indexes (TTIs) surged as bad news (CPI reading) turned into good news for equities.
Here’s how we closed 2/14/2018:
Domestic TTI: +2.75% above its M/A (last close +2.12%)—Buy signal effective 4/4/2016
International TTI: +3.92% above its M/A (last close +2.33%)—Buy signal effective 7/19/2016
Disclosure: I am obliged to inform you that I, as well as my advisory clients, own some of the ETFs listed in the above table. Furthermore, they do not represent a specific investment recommendation for you, they merely show which ETFs from the universe I track are falling within the guidelines specified.
Contact Ulli