
- Moving the markets
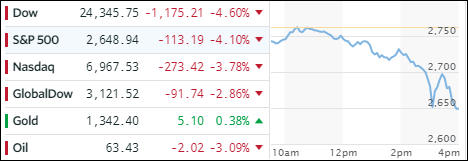
After last week’s pullback, today’s session had the major indexes hovering slightly below their unchanged lines right after the opening, when suddenly at mid-day the floodgates opened and equities went into freefall mode. Of course, the reason was not that individual investors all of a sudden decided to sell, but the more likely was catalyst that the computer algos played ping-pong and pushed equities south. Besides, we’ve come way too far too fast in terms of past year’s rally that a correction was way overdue.
As ZH reports, in terms of records, this was the biggest drop for the S&P 500 since August 2011 and the 410-day record streak without a 5% correction is over. Nasdaq is over 7% off its highs; Dow & S&P are over 8% off their highs. The VIX exploded to reach 37, which is quite a jump from the lows of just above 9 back in November.
One of the causes of the increased volatility has been the spike in interest rates since last September. Today, the 10-year yield jumped again touching 2.84% intra-day but pulled back to close down 7 basis points to end at 2.77%. Again, bucking the trend was the US Dollar (UUP), which has been in a bear market for the past year, but managed to bounce higher by +0.43%.
Our Trend Tracking Indexes (TTIs) remain on the bullish side of their respective trend lines (see section 3 below) but several of our trailing sell stops were triggered for some of our holdings and will be liquidated tomorrow. That is, unless a rebound rally is in the making in which case I will hold off another day.
- ETFs in the Spotlight
In case you missed the announcement and description of this section, you can read it here again.
It features 10 broadly diversified and sector ETFs from my HighVolume list as posted every Saturday. Furthermore, they are screened for the lowest MaxDD% number meaning they have been showing better resistance to temporary sell offs than all others over the past year.
The below table simply demonstrates the magnitude with which some of the ETFs are fluctuating in regards to their positions above or below their respective individual trend lines (%M/A). A break below, represented by a negative number, shows weakness, while a break above, represented by a positive percentage, shows strength.
For hundreds of ETF choices, be sure to reference Thursday’s StatSheet.
Year to date, here’s how our candidates have fared so far:
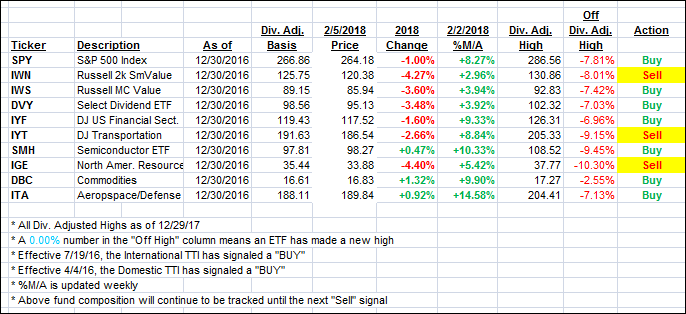
Again, the %M/A column above shows the position of the various ETFs in relation to their respective long term trend lines, while the trailing sell stops are being tracked in the “Off High” column. The “Action” column will signal a “Sell” once the -7.5% point has been taken out in the “Off High” column.
- Trend Tracking Indexes (TTIs)
Our Trend Tracking Indexes (TTIs) took a dive as markets worldwide went into retreat mode; however, we remain in bullish territory.
Here’s how we closed 2/5/2018:
Domestic TTI: +2.11% above its M/A (last close +3.60%)—Buy signal effective 4/4/2016
International TTI: +2.80% above its M/A (last close +6.09%)—Buy signal effective 7/19/2016
Disclosure: I am obliged to inform you that I, as well as my advisory clients, own some of the ETFs listed in the above table. Furthermore, they do not represent a specific investment recommendation for you, they merely show which ETFs from the universe I track are falling within the guidelines specified.
Contact Ulli