
- Moving the markets
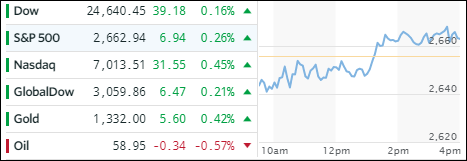
The major indexes slipped right after the opening bell and remained below their respective unchanged lines for most of the day but ended up crawling into the green to close with modest gains. Saving the day was new Fed Head Jay Powel after uttering words like financial stability, which was music to the ears of the traders to leave the early bearish mind set.
Nevertheless, activity was subdued ahead of tomorrow’s key inflation reading on January’s CPI. Traders are worried that a “hotter” than expected number could create another sell-off with higher prices causing the Fed to hike rates at a faster pace to control inflationary forces. That would spike volatility and could lead to a repeat of last week’s negative effect on equities.
Not helping matters was Trump’s proposed $4.4 trillion federal budget, which would just about see the current deficit (2017) double and in the next year and climb some $7 trillion over the next decade, which for sure will have Treasury yields jump as higher interest rates are baked in the cake.
However, today, bond yields pulled back slightly with the 10-year dropping 3 basis points to end at 2.83%. The US Dollar (UUP), which rebounded off its lows last week, returned to its bearish trend by losing -0.55%.
- ETFs in the Spotlight
In case you missed the announcement and description of this section, you can read it here again.
It features 10 broadly diversified and sector ETFs from my HighVolume list as posted every Saturday. Furthermore, they are screened for the lowest MaxDD% number meaning they have been showing better resistance to temporary sell offs than all others over the past year.
The below table simply demonstrates the magnitude with which some of the ETFs are fluctuating in regards to their positions above or below their respective individual trend lines (%M/A). A break below, represented by a negative number, shows weakness, while a break above, represented by a positive percentage, shows strength.
For hundreds of ETF choices, be sure to reference Thursday’s StatSheet.
Year to date, here’s how our candidates have fared so far:
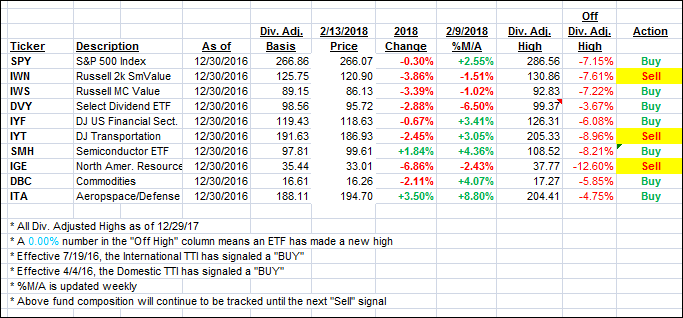
Again, the %M/A column above shows the position of the various ETFs in relation to their respective long term trend lines, while the trailing sell stops are being tracked in the “Off High” column. The “Action” column will signal a “Sell” once the -7.5% point has been taken out in the “Off High” column.
- Trend Tracking Indexes (TTIs)
Our Trend Tracking Indexes (TTIs) crawled higher as the major indexes eked out a gain.
Here’s how we closed 2/13/2018:
Domestic TTI: +2.12% above its M/A (last close +2.03%)—Buy signal effective 4/4/2016
International TTI: +2.33% above its M/A (last close +2.23%)—Buy signal effective 7/19/2016
Disclosure: I am obliged to inform you that I, as well as my advisory clients, own some of the ETFs listed in the above table. Furthermore, they do not represent a specific investment recommendation for you, they merely show which ETFs from the universe I track are falling within the guidelines specified.
Contact Ulli