
- Moving the markets
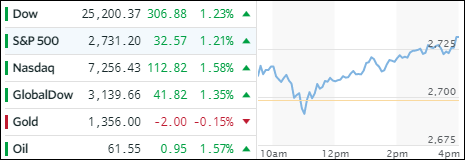
The equity bounce continued for the fifth day in a row, as the major indexes started the session in the positive, then dropped below the unchanged line and subsequently surged in a V-shape type recovery without looking back to close at the highs for the day. I took the opportunity during the momentary weakness to add to our positions as mentioned yesterday.
Apparently, Wednesday’s “hot” CPI report still did not bother traders who simply shrugged it off and proceeded driving the markets higher by continuing with their short squeeze, which is now on record as the biggest since the election. The VIX diverged today closing modestly higher while the S&P remained in rally mode.
Interest rates pulled back with the 10-year yield dropping 1 basis point to 2.90%. The US Dollar (UUP) showed some strength early on, then collapsed (down for the 5th day in a row) to its lowest close since December 2014.
- ETFs in the Spotlight
In case you missed the announcement and description of this section, you can read it here again.
It features 10 broadly diversified and sector ETFs from my HighVolume list as posted every Saturday. Furthermore, they are screened for the lowest MaxDD% number meaning they have been showing better resistance to temporary sell offs than all others over the past year.
The below table simply demonstrates the magnitude with which some of the ETFs are fluctuating in regards to their positions above or below their respective individual trend lines (%M/A). A break below, represented by a negative number, shows weakness, while a break above, represented by a positive percentage, shows strength.
For hundreds of ETF choices, be sure to reference Thursday’s StatSheet.
Year to date, here’s how our candidates have fared so far:
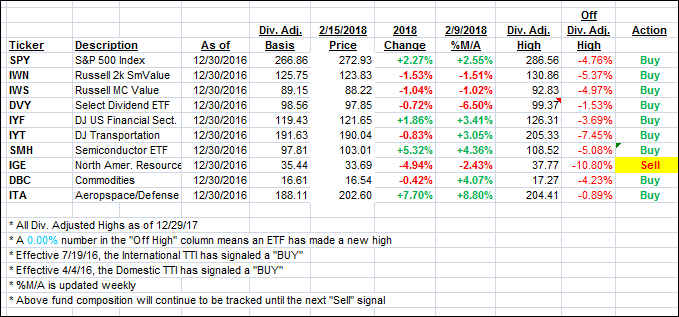
Again, the %M/A column above shows the position of the various ETFs in relation to their respective long term trend lines, while the trailing sell stops are being tracked in the “Off High” column. The “Action” column will signal a “Sell” once the -7.5% point has been taken out in the “Off High” column.
- Trend Tracking Indexes (TTIs)
Our Trend Tracking Indexes (TTIs) continued their northerly path as equities rebounded.
Here’s how we closed 2/15/2018:
Domestic TTI: +3.28% above its M/A (last close +2.75%)—Buy signal effective 4/4/2016
International TTI: +4.72% above its M/A (last close +3.92%)—Buy signal effective 7/19/2016
Disclosure: I am obliged to inform you that I, as well as my advisory clients, own some of the ETFs listed in the above table. Furthermore, they do not represent a specific investment recommendation for you, they merely show which ETFs from the universe I track are falling within the guidelines specified.
Contact Ulli