
- Moving the markets
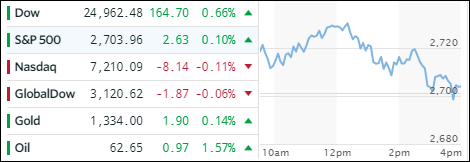
In a repeat performance from yesterday, we watched an early rally lose steam and head back south below the unchanged line, when last minute buying pushed the Dow and Nasdaq higher to close in the green. However, the Nasdaq slid for the 4th day in a row. Ongoing concerns about rising inflation and bond yields took center stage.
To calm the markets after yesterday’s tumultuous release of the minutes, the Fed paraded one of its mouthpieces, Fed President James Bullard, to calm the troops by reiterating that “everything needs to be perfect” for 4 rate hikes. That comment had the desired effect early on but did not last for the entire session.
However, Bullard did have an effect on Treasury yields, which slipped today with the 10-year giving back 2 basis points to 2.92% thereby postponing the day when the 3% level will be surpassed. After its recent bounce-back, thanks to higher yields, the US Dollar (UUP) headed back south and lost -0.34%. We are still at that moment in time where the markets could either resume its long-term bullish trend or collapse to test its recent sell-off lows.
- ETFs in the Spotlight
In case you missed the announcement and description of this section, you can read it here again.
It features 10 broadly diversified and sector ETFs from my HighVolume list as posted every Saturday. Furthermore, they are screened for the lowest MaxDD% number meaning they have been showing better resistance to temporary sell offs than all others over the past year.
The below table simply demonstrates the magnitude with which some of the ETFs are fluctuating in regards to their positions above or below their respective individual trend lines (%M/A). A break below, represented by a negative number, shows weakness, while a break above, represented by a positive percentage, shows strength.
For hundreds of ETF choices, be sure to reference Thursday’s StatSheet.
Year to date, here’s how our candidates have fared so far:
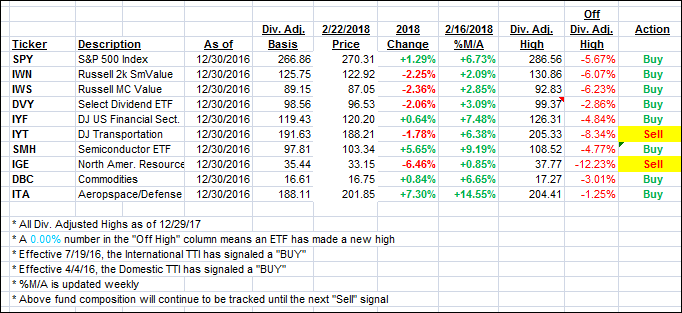
Again, the %M/A column above shows the position of the various ETFs in relation to their respective long term trend lines, while the trailing sell stops are being tracked in the “Off High” column. The “Action” column will signal a “Sell” once the -7.5% point has been taken out in the “Off High” column.
- Trend Tracking Indexes (TTIs)
Our Trend Tracking Indexes (TTIs) edged higher despite an early rally dying on the vine.
Here’s how we closed 2/22/2018:
Domestic TTI: +2.85% above its M/A (last close +2.80%)—Buy signal effective 4/4/2016
International TTI: +3.57% above its M/A (last close +3.49%)—Buy signal effective 7/19/2016
Disclosure: I am obliged to inform you that I, as well as my advisory clients, own some of the ETFs listed in the above table. Furthermore, they do not represent a specific investment recommendation for you, they merely show which ETFs from the universe I track are falling within the guidelines specified.
Contact Ulli