

- Moving the markets
The move into record territory continued for the third straight day with the Dow climbing above its psychologically important 25k marker for the first time in history. Upward momentum remained strong throughout the session and into the close. Helping matters was the weakening of the VIX, which made history itself by trading with an 8 handle for the 2nd day in a row… a first in the history of stocks.
Our ETFs had a good day as well with all of our holdings closing in the green again. Leadership rotated a bit from yesterday as Financials (XLF) headed the group with +0.96% with International Equities (SCHF) taking a close 2nd with +0.91%. This was followed by Aerospace & Defense (ITA +0.69%) and Semiconductors (SMH +0.51%).
Gold had a record of its own, but not in price but by sporting a rebound rally that has now lasted 10 straight days, which equaled the record win streak of 7/18/2011. Interest rates headed south, but only by small margin leaving the 20-year bond (TLT -0.02%) essentially unchanged. Yesterday’s one-day bounce in the US Dollar (UUP) came to an end, as the downtrend resumed with UUP surrendering -0.33%.
- ETFs in the Spotlight
In case you missed the announcement and description of this section, you can read it here again.
It features 10 broadly diversified and sector ETFs from my HighVolume list as posted every Saturday. Furthermore, they are screened for the lowest MaxDD% number meaning they have been showing better resistance to temporary sell offs than all others over the past year.
The below table simply demonstrates the magnitude with which some of the ETFs are fluctuating in regards to their positions above or below their respective individual trend lines (%M/A). A break below, represented by a negative number, shows weakness, while a break above, represented by a positive percentage, shows strength.
For hundreds of ETF choices, be sure to reference Thursday’s StatSheet.
Year to date, here’s how our candidates have fared so far:
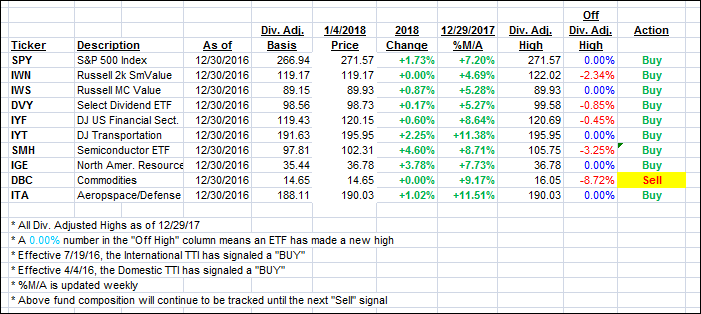
Again, the %M/A column above shows the position of the various ETFs in relation to their respective long term trend lines, while the trailing sell stops are being tracked in the “Off High” column. The “Action” column will signal a “Sell” once the -7.5% point has been taken out in the “Off High” column.
- Trend Tracking Indexes (TTIs)
Our Trend Tracking Indexes (TTIs) jumped again as the bulls remained in full control.
Here’s how we closed 1/4/2018:
Domestic TTI: +4.26% above its M/A (last close +4.15%)—Buy signal effective 4/4/2016
International TTI: +6.60% above its M/A (last close +5.82%)—Buy signal effective 7/19/2016
Disclosure: I am obliged to inform you that I, as well as my advisory clients, own some of the ETFs listed in the above table. Furthermore, they do not represent a specific investment recommendation for you, they merely show which ETFs from the universe I track are falling within the guidelines specified.
Contact Ulli