
- Moving the markets
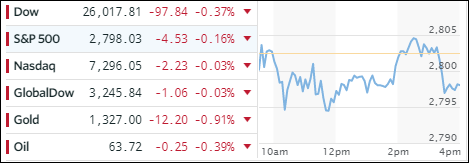
The major indexes started the day in negative territory, recovered and moved briefly above the unchanged line but then sold off into the close resulting in minor losses. While the Dow managed to hang on to its 26k level, the S&P slipped below its 2,800 milestone and tied the longest stretch in history without a 5% pullback at 394 sessions, according to MarketWatch.
Keeping the markets in check were worries about the potential of a partial government shutdown this weekend as well as earnings reports that were ok but not great.
This uncertainty flowed over to ETF space as well, where the picture was mixed. Closing up were Semiconductors (SMH +0.74%), Emerging Markets (SCHE +0.27%) and Transportations (IYT +0.06%). Heading south were Aerospace & Defense (ITA -0.80%), SmallCaps (SCHA -0.64%) and International SmallCaps (SCHC -0.42%).
Interest rates rose with the 10-year bond yield rising 5 basis points to close at 2.62% after having reached an intra-day high of 2.64%, the highest level since December 2016. The US Dollar (UUP) continued its recent pattern, namely being pushed higher early in the session only to be dumped into the close (-0.13%).
- ETFs in the Spotlight
In case you missed the announcement and description of this section, you can read it here again.
It features 10 broadly diversified and sector ETFs from my HighVolume list as posted every Saturday. Furthermore, they are screened for the lowest MaxDD% number meaning they have been showing better resistance to temporary sell offs than all others over the past year.
The below table simply demonstrates the magnitude with which some of the ETFs are fluctuating in regards to their positions above or below their respective individual trend lines (%M/A). A break below, represented by a negative number, shows weakness, while a break above, represented by a positive percentage, shows strength.
For hundreds of ETF choices, be sure to reference Thursday’s StatSheet.
Year to date, here’s how our candidates have fared so far:
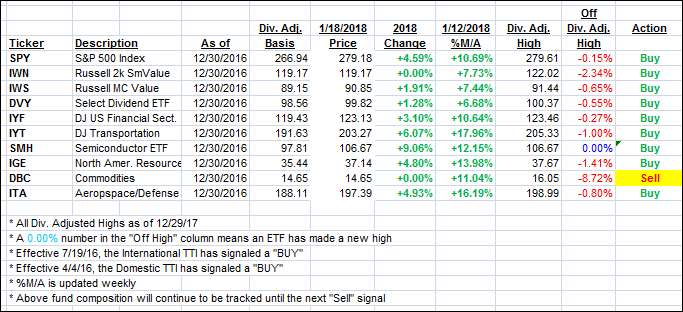
Again, the %M/A column above shows the position of the various ETFs in relation to their respective long term trend lines, while the trailing sell stops are being tracked in the “Off High” column. The “Action” column will signal a “Sell” once the -7.5% point has been taken out in the “Off High” column.
- Trend Tracking Indexes (TTIs)
Our Trend Tracking Indexes (TTIs) slipped a tad as the major indexes were in pause mode after the recent run-up.
Here’s how we closed 1/18/2018:
Domestic TTI: +4.97% above its M/A (last close +5.01%)—Buy signal effective 4/4/2016
International TTI: +8.59% above its M/A (last close +8.61%)—Buy signal effective 7/19/2016
Disclosure: I am obliged to inform you that I, as well as my advisory clients, own some of the ETFs listed in the above table. Furthermore, they do not represent a specific investment recommendation for you, they merely show which ETFs from the universe I track are falling within the guidelines specified.
Contact Ulli