
ETF Tracker StatSheet
https://theetfbully.com/2018/01/weekly-statsheet-etf-tracker-newsletter-updated-01-25-2018/
BEST START TO A YEAR FOR DOW AND S&P 500 SINCE 1987
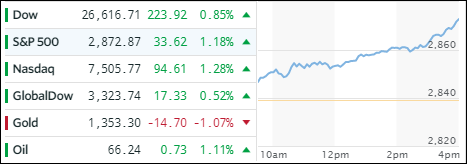
- Moving the markets
Another day with solid advances for the major indexes (in the face of a rising VIX) as the Dow, Nasdaq and S&P 500 gained for the 4th week in a row (and 9 for the last 10 for Dow and S&P 500). At the same time, the S&P eclipsed Goldman Sachs’s 2018 year-end-target of 2,850, which clearly demonstrates the value of forecasting. Hat tip goes to ZH for these historical nuggets.
As a result, gains were broadly spread, and the ETF space was no exception with green being the color of the day. Heading the leaders were Semiconductors (SMH) with an impressive +3.18% move higher. Lagging behind, but with solid gains nonetheless, was the Dividend ETF (SCHD +1.70%), Aerospace& Defense (ITA +1.31%) and Emerging Markets (SCHE +1.30%). Low man on the totem pole was US SmallCaps (SCHA) with +0.38%.
Interest rates rose with 10-year bond yield climbing 3 basis points to end at 2.66%. Intra-day, it attempted to break through the 2.67% level, but the glass ceiling held. Oil managed to rally while gold took a breather and pulled back. Ah, yes, and then there is the whipping boy of the past twelve months, namely the US Dollar (UUP), which had its worst start to a year since 1987 and continued its bad fortune by dropping another -0.21% on the day. But, the administration confirmed that we have a strong dollar policy. Go figure…
- ETFs in the Spotlight
In case you missed the announcement and description of this section, you can read it here again.
It features 10 broadly diversified and sector ETFs from my HighVolume list as posted every Saturday. Furthermore, they are screened for the lowest MaxDD% number meaning they have been showing better resistance to temporary sell offs than all others over the past year.
The below table simply demonstrates the magnitude with which some of the ETFs are fluctuating in regards to their positions above or below their respective individual trend lines (%M/A). A break below, represented by a negative number, shows weakness, while a break above, represented by a positive percentage, shows strength.
For hundreds of ETF choices, be sure to reference Thursday’s StatSheet.
Year to date, here’s how our candidates have fared so far:
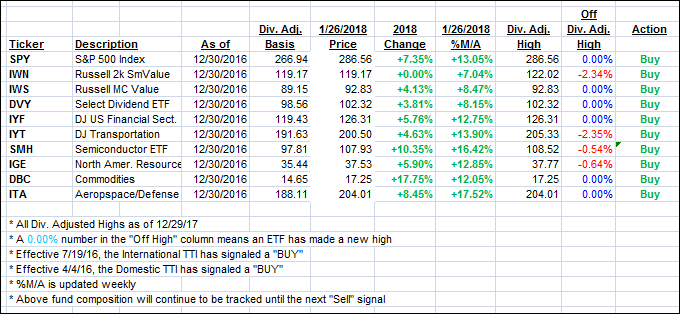
Again, the %M/A column above shows the position of the various ETFs in relation to their respective long term trend lines, while the trailing sell stops are being tracked in the “Off High” column. The “Action” column will signal a “Sell” once the -7.5% point has been taken out in the “Off High” column.
- Trend Tracking Indexes (TTIs)
Our Trend Tracking Indexes (TTIs) picked up speed and jumped higher.
Here’s how we closed 1/26/2018:
Domestic TTI: +5.40% above its M/A (last close +5.26%)—Buy signal effective 4/4/2016
International TTI: +9.70% above its M/A (last close +9.22%)—Buy signal effective 7/19/2016
Disclosure: I am obliged to inform you that I, as well as my advisory clients, own some of the ETFs listed in the above table. Furthermore, they do not represent a specific investment recommendation for you, they merely show which ETFs from the universe I track are falling within the guidelines specified.
————————————————————-
READER Q & As
All Reader Q & A’s are listed at our web site!
Check it out at:
https://theetfbully.com/questions-answers/
———————————————————-
WOULD YOU LIKE TO HAVE YOUR INVESTMENTS PROFESSIONALLY MANAGED?
Do you have the time to follow our investment plans yourself? If you are a busy professional who would like to have his portfolio managed using our methodology, please contact me directly or get more details at:
https://theetfbully.com/personal-investment-management/
———————————————————
Back issues of the ETF/No Load Fund Tracker are available on the web at:
https://theetfbully.com/newsletter-archives/
Contact Ulli