
ETF Tracker StatSheet
https://theetfbully.com/2018/01/weekly-statsheet-etf-tracker-newsletter-updated-01-18-2018/
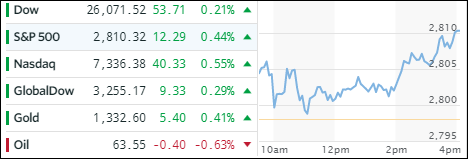
POSSIBLE GOVERNMENT SHUTDOWN; MARKETS RALLY
- Moving the markets
It was a tug-of-war today that featured optimism over corporate earnings against the threat of a looming government shutdown. Despite the latter potentially adding more uncertainty, traders decided that any economic impact would negligible, so up we went late in the session with the S&P 500 and Nasdaq setting new records. As a side note, this is now the second week in a row that the S&P 500 and VIX were higher together, an event that hasn’t happen since 2013.
Today’s action benefited the ETF space with all of our holdings showing green numbers. Taking top billing were SmallCaps (SCHA) with a solid performance of +1.14%, followed by MidCaps (SCHM +0.95%) and Emerging Markets (SCHE +0.80%). Low man on the totem pole was Semiconductors (SMH) with +0.09%.
Interest rates kept creeping higher with the 10-year bond yield adding 2 basis points to end the week at 2.64%, its highest level since mid-2014. Gold held steady, but the whipping boy of the past year, namely the US Dollar (UUP), did a pump and dump by retreating early in the session and then recovering and managing to climb above the unchanged line by a meager +0.17%.
- ETFs in the Spotlight
In case you missed the announcement and description of this section, you can read it here again.
It features 10 broadly diversified and sector ETFs from my HighVolume list as posted every Saturday. Furthermore, they are screened for the lowest MaxDD% number meaning they have been showing better resistance to temporary sell offs than all others over the past year.
The below table simply demonstrates the magnitude with which some of the ETFs are fluctuating in regards to their positions above or below their respective individual trend lines (%M/A). A break below, represented by a negative number, shows weakness, while a break above, represented by a positive percentage, shows strength.
For hundreds of ETF choices, be sure to reference Thursday’s StatSheet.
Year to date, here’s how our candidates have fared so far:
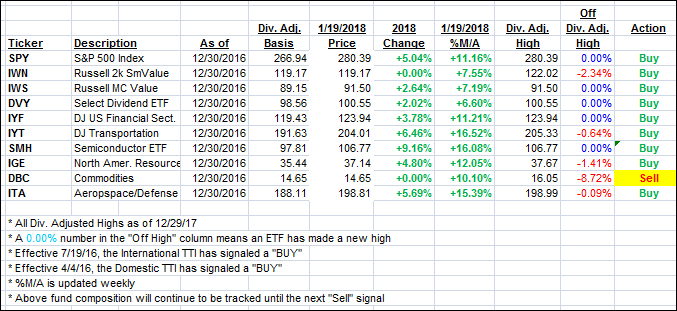
Again, the %M/A column above shows the position of the various ETFs in relation to their respective long term trend lines, while the trailing sell stops are being tracked in the “Off High” column. The “Action” column will signal a “Sell” once the -7.5% point has been taken out in the “Off High” column.
- Trend Tracking Indexes (TTIs)
Our Trend Tracking Indexes (TTIs) were mixed with the Domestic one climbing a tad while the International one slipped a fraction.
Here’s how we closed 1/19/2018:
Domestic TTI: +5.04% above its M/A (last close +4.97%)—Buy signal effective 4/4/2016
International TTI: +8.52% above its M/A (last close +8.59%)—Buy signal effective 7/19/2016
Disclosure: I am obliged to inform you that I, as well as my advisory clients, own some of the ETFs listed in the above table. Furthermore, they do not represent a specific investment recommendation for you, they merely show which ETFs from the universe I track are falling within the guidelines specified.
————————————————————-
READER Q & As
All Reader Q & A’s are listed at our web site!
Check it out at:
https://theetfbully.com/questions-answers/
———————————————————-
WOULD YOU LIKE TO HAVE YOUR INVESTMENTS PROFESSIONALLY MANAGED?
Do you have the time to follow our investment plans yourself? If you are a busy professional who would like to have his portfolio managed using our methodology, please contact me directly or get more details at:
https://theetfbully.com/personal-investment-management/
———————————————————
Back issues of the ETF/No Load Fund Tracker are available on the web at:
https://theetfbully.com/newsletter-archives/
Contact Ulli