
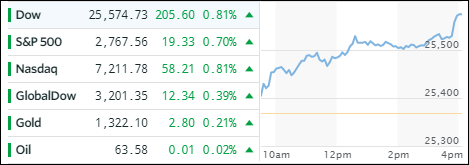
- Moving the markets
Yesterday’s worries about China’s lack of interest in purchasing US Treasuries are now a thing of the past while other concerns, such as jobless claims and wholesale inflation data, were simply ignored in anticipation of a hopefully great earnings season, which is expected to be the catalyst to drive the markets to new highs.
So, up we went right after the opening bell, never looked back, and the major indexes, actually accelerated into the close setting new all-time highs across the board. Yes, even the YTD lagging SmallCaps participated. Surprisingly, all this happened with the VIX rising and testing the 10 level.
Showing strong leadership in our ETF space were Transportations (IYT) with an impressive +2.37% gain, which made it not only its 8th up day in a row but also its best start to a year since 2001. Taking second and third place were SmallCaps (SCHA +1.62%) and MidCaps (SCHM +1.14%). Lagging the bunch were Semiconductors (SMH) with +0.47%.
Treasury yields reversed from their recent rally with the 10-year yield giving back 1 basis point to 2.54%, while the 30-year auction attracted a lot of interest contributing to the lower yield scenario. The US Dollar (UUP) was not so lucky and plunged -0.42% and is now in danger of taking out the lows made earlier this year.
- ETFs in the Spotlight
In case you missed the announcement and description of this section, you can read it here again.
It features 10 broadly diversified and sector ETFs from my HighVolume list as posted every Saturday. Furthermore, they are screened for the lowest MaxDD% number meaning they have been showing better resistance to temporary sell offs than all others over the past year.
The below table simply demonstrates the magnitude with which some of the ETFs are fluctuating in regards to their positions above or below their respective individual trend lines (%M/A). A break below, represented by a negative number, shows weakness, while a break above, represented by a positive percentage, shows strength.
For hundreds of ETF choices, be sure to reference Thursday’s StatSheet.
Year to date, here’s how our candidates have fared so far:
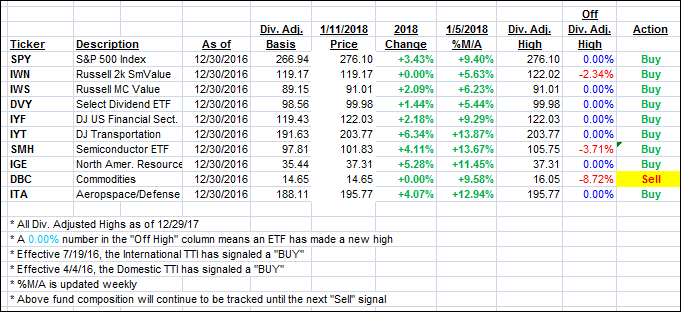
Again, the %M/A column above shows the position of the various ETFs in relation to their respective long term trend lines, while the trailing sell stops are being tracked in the “Off High” column. The “Action” column will signal a “Sell” once the -7.5% point has been taken out in the “Off High” column.
- Trend Tracking Indexes (TTIs)
Our Trend Tracking Indexes (TTIs) rallied strongly as the bulls were clearly in charge.
Here’s how we closed 1/11/2018:
Domestic TTI: +4.78% above its M/A (last close +4.47%)—Buy signal effective 4/4/2016
International TTI: +7.67% above its M/A (last close +7.04%)—Buy signal effective 7/19/2016
Disclosure: I am obliged to inform you that I, as well as my advisory clients, own some of the ETFs listed in the above table. Furthermore, they do not represent a specific investment recommendation for you, they merely show which ETFs from the universe I track are falling within the guidelines specified.
Contact Ulli