
- Moving the markets
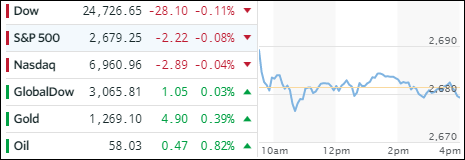
The major indexes slipped a bit as the much touted and hyped tax deal appeared to be done, and the legislation was finally sent to President Trump for his signature. It seems that the bill’s passage left investors emotionally exhausted and apathetic as the actual news was a non-event in terms of market direction.
Despite an early bounce, the indexes spent the day hovering slightly above and below their respective unchanged lines, which was reflected in a mixed performance in the ETF space. Leading to the upside were Transportations (IYT +0.94%), Semiconductors (SMH +0.65%) and International SmallCaps (SCHC +0.28%). Giving back some of their recent gains were the Financials (XLF -0.18%) and International Equities (SCHF -0.06%).
Interest rates continued to surge with the 10-year bond yield adding another 3 basis points to 2.49%, its highest level since last March. That rise resulted in another spanking for the 30-year bond (TLT), which gapped down for the second day in a row (-1.11%) to a 4-week low. The US dollar (UUP) followed suit by losing -0.12% and remaining below its 50-day M/A.
- ETFs in the Spotlight
In case you missed the announcement and description of this section, you can read it here again.
It features 10 broadly diversified and sector ETFs from my HighVolume list as posted every Saturday. Furthermore, they are screened for the lowest MaxDD% number meaning they have been showing better resistance to temporary sell offs than all others over the past year.
The below table simply demonstrates the magnitude with which some of the ETFs are fluctuating in regards to their positions above or below their respective individual trend lines (%M/A). A break below, represented by a negative number, shows weakness, while a break above, represented by a positive percentage, shows strength.
For hundreds of ETF choices, be sure to reference Thursday’s StatSheet.
Year to date, here’s how the 2017 candidates have fared so far:
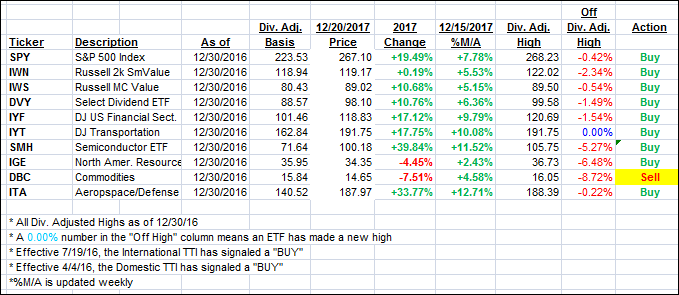
Again, the %M/A column above shows the position of the various ETFs in relation to their respective long term trend lines, while the trailing sell stops are being tracked in the “Off High” column. The “Action” column will signal a “Sell” once the -7.5% point has been taken out in the “Off High” column.
- Trend Tracking Indexes (TTIs)
Our Trend Tracking Indexes (TTIs) dropped a tiny bit as the tax bill passage took the starch out of an early rally attempt.
Here’s how we closed 12/20/2017:
Domestic TTI: +4.00% above its M/A (last close +4.08%)—Buy signal effective 4/4/2016
International TTI: +4.79% above its M/A (last close +5.01%)—Buy signal effective 7/19/2016
Disclosure: I am obliged to inform you that I, as well as my advisory clients, own some of the ETFs listed in the above table. Furthermore, they do not represent a specific investment recommendation for you, they merely show which ETFs from the universe I track are falling within the guidelines specified.
Contact Ulli