
- Moving the markets
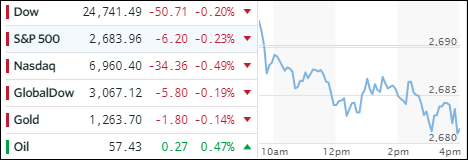
The major indexes slipped today as all eyes remained firmly focused on the tax package, which originally was supposed to be signed by President Trump today. However, after the markets closed, the process “hit a procedural snag” forcing another vote on Wednesday. Whether that will finally cinch the deal is everyone’s guess.
Equities headed south, after a short-lived early bounce, and the ETF space was no exception, as we gave back some of the gains of the last couple of days. Showing the only green number was the Dividend ETF (SCHD) with +0.06%. Surrendering the most were SmallCaps (SCHA) with -0.66% followed by Financials (XLF -0.43%) and Aerospace & Defense (ITA -0.41%).
Yesterday’s interest rate spike continued with the 10-year yield bouncing sharply higher by adding 7 basis points to 2.46% matching the late October high. As a result, the 20-year bond (TLT) got hammered and lost -1.30%. In summary, it was one of those days were bonds and equities were down simultaneously. The US Dollar (UUP) traded in a wide range but lost only -0.29%.
- ETFs in the Spotlight
In case you missed the announcement and description of this section, you can read it here again.
It features 10 broadly diversified and sector ETFs from my HighVolume list as posted every Saturday. Furthermore, they are screened for the lowest MaxDD% number meaning they have been showing better resistance to temporary sell offs than all others over the past year.
The below table simply demonstrates the magnitude with which some of the ETFs are fluctuating in regards to their positions above or below their respective individual trend lines (%M/A). A break below, represented by a negative number, shows weakness, while a break above, represented by a positive percentage, shows strength.
For hundreds of ETF choices, be sure to reference Thursday’s StatSheet.
Year to date, here’s how the 2017 candidates have fared so far:
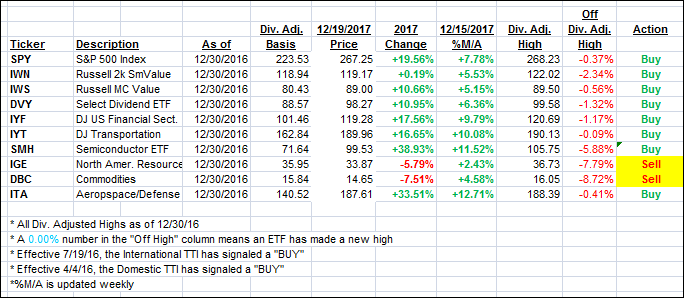
Again, the %M/A column above shows the position of the various ETFs in relation to their respective long term trend lines, while the trailing sell stops are being tracked in the “Off High” column. The “Action” column will signal a “Sell” once the -7.5% point has been taken out in the “Off High” column.
- Trend Tracking Indexes (TTIs)
Our Trend Tracking Indexes (TTIs) slipped as bearish forces dominated.
Here’s how we closed 12/19/2017:
Domestic TTI: +4.08% above its M/A (last close +4.77%)—Buy signal effective 4/4/2016
International TTI: +5.01% above its M/A (last close +5.35%)—Buy signal effective 7/19/2016
Disclosure: I am obliged to inform you that I, as well as my advisory clients, own some of the ETFs listed in the above table. Furthermore, they do not represent a specific investment recommendation for you, they merely show which ETFs from the universe I track are falling within the guidelines specified.
Contact Ulli