
- Moving the markets
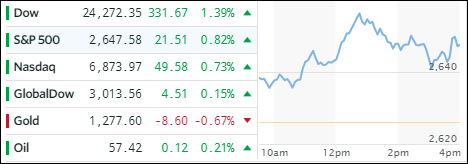
And the beat goes on. Optimism about the tax plan prospects went into hyper drive with John McCain appearing to be the catalyst by casting his “YES” vote convincing traders that a tax reform may actually happen. That motivated the bullish crowd, and the major indexes jumped. Even though we came off the highs mid-day, it was enough for the Dow to register its longest streak of monthly gains in 22 years.
In ETF space, we saw gains of varying degrees across the board. Following through on yesterday’s top performance of +3.4% were Transportations (IYT), which added another +2.01%. That was followed by Aerospace & Defense (ITA) and the Dividend ETF (SCHD) with +1.25% and +0.94% respectively. Not being aligned with today’s bullish theme were Emerging Markets (SCHE) with a loss of -0.76%.
Interest rates rose sharply with the 10-year bond yield jumping 5 basis points to 2.42%. Gold got spanked again and lost -0.74%. Every time the yellow metal is in danger of breaking through its $1,300 marker, it gets slammed down thanks to the manipulated derivatives markets on the COMEX. The US dollar (UUP) managed to recover some of its early losses but still closed down -0.25%.
- ETFs in the Spotlight (updated for 2017)
In case you missed the announcement and description of this section, you can read it here again.
It features 10 broadly diversified and sector ETFs from my HighVolume list as posted every Saturday. Furthermore, they are screened for the lowest MaxDD% number meaning they have been showing better resistance to temporary sell offs than all others over the past year.
The below table simply demonstrates the magnitude with which some of the ETFs are fluctuating in regards to their positions above or below their respective individual trend lines (%M/A). A break below, represented by a negative number, shows weakness, while a break above, represented by a positive percentage, shows strength.
For hundreds of ETF choices, be sure to reference Thursday’s StatSheet.
Year to date, here’s how the 2017 candidates have fared so far:
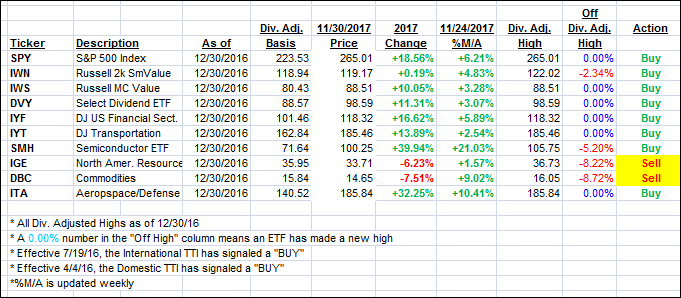
Again, the %M/A column above shows the position of the various ETFs in relation to their respective long term trend lines, while the trailing sell stops are being tracked in the “Off High” column. The “Action” column will signal a “Sell” once the -7.5% point has been taken out in the “Off High” column.
- Trend Tracking Indexes (TTIs)
Our Trend Tracking Indexes (TTIs) headed north as bullish momentum was restored.
Here’s how we closed 11/30/2017:
Domestic TTI: +3.80% above its M/A (last close +3.50%)—Buy signal effective 4/4/2016
International TTI: +6.11% above its M/A (last close +6.02%)—Buy signal effective 7/19/2016
Disclosure: I am obliged to inform you that I, as well as my advisory clients, own some of the ETFs listed in the above table. Furthermore, they do not represent a specific investment recommendation for you, they merely show which ETFs from the universe I track are falling within the guidelines specified.
Contact Ulli