
- Moving the markets
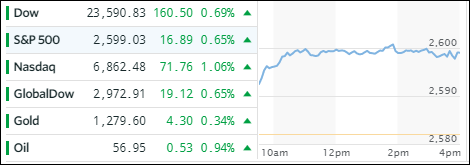
Never mind the political crisis in Germany. European equities started the day rallying sharply and then handed the baton to the US giving domestic stocks the opportunity to run towards the finish line, which they did assisted by the VIX, which got hammered to 9 (from its recent high of 12). That allowed the major indexes to score another win for the record books. The S&P 500 managed to kiss the 2,600 level for the first time and closed a tad below it.
The “most shorted stocks” had quite a run the past week as they soared over 6%, which was biggest squeeze since December 2016. Our ETF portfolios benefited from all this action and we closed solidly in the green again. Leading the charge with gains of over 1% were Emerging Markets (SCHE +1.36%), Aerospace & Defense (ITA +1.10%), Semiconductors (SMH +1.02%) and Transportations (IYT +1.01%). Low man on the totem pole was the financial sector (XLF) with +0.30%.
Interest rates were steady with the yield on the 10-year bond dropping 1 basis point to 2.36%. The High Yield sector (HYG), which was embroiled in a sharp sell off a few sessions ago, calmed down and rebounded another +0.18%. After gold’s massive sell-off yesterday, the yellow metal managed a small come back at the tune of +0.50%. The US Dollar (UUP) traded in a tight range again and lost a tiny -0.12%.
- ETFs in the Spotlight (updated for 2017)
In case you missed the announcement and description of this section, you can read it here again.
It features 10 broadly diversified and sector ETFs from my HighVolume list as posted every Saturday. Furthermore, they are screened for the lowest MaxDD% number meaning they have been showing better resistance to temporary sell offs than all others over the past year.
The below table simply demonstrates the magnitude with which some of the ETFs are fluctuating in regards to their positions above or below their respective individual trend lines (%M/A). A break below, represented by a negative number, shows weakness, while a break above, represented by a positive percentage, shows strength.
For hundreds of ETF choices, be sure to reference Thursday’s StatSheet.
Year to date, here’s how the 2017 candidates have fared so far:
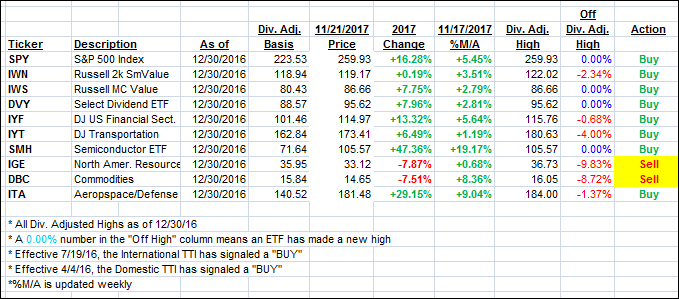
Again, the %M/A column above shows the position of the various ETFs in relation to their respective long term trend lines, while the trailing sell stops are being tracked in the “Off High” column. The “Action” column will signal a “Sell” once the -7.5% point has been taken out in the “Off High” column.
- Trend Tracking Indexes (TTIs)
Our Trend Tracking Indexes (TTIs) jumped as the major indexes roared into record territory.
Here’s how we closed 11/21/2017:
Domestic TTI: +3.44% above its M/A (last close +3.03%)—Buy signal effective 4/4/2016
International TTI: +5.92% above its M/A (last close +5.27%)—Buy signal effective 7/19/2016
Disclosure: I am obliged to inform you that I, as well as my advisory clients, own some of the ETFs listed in the above table. Furthermore, they do not represent a specific investment recommendation for you, they merely show which ETFs from the universe I track are falling within the guidelines specified.
Contact Ulli