
- Moving the Markets
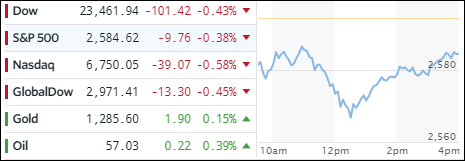
The Dow’s seven-day win streak came to an end today, as technology and industrials took the brunt of the sell-off, the negative effects of which were greatly reduced thanks to the afternoon rebound. However, worries about a possible delay in the implementation of the corporate tax cut plan by one year proved to be too bearish of an influence for the indexes to conquer the unchanged line. In the end, equities had their worst session in two weeks.
The ETFs space was not immune from today’s pullback, as green numbers were noticeably absent. To no surprise, the biggest gainer of the year, Semiconductors (SMH), led the downside leaders with -1.95% followed by Aerospace & Defense (ITA) with -1.48%. Holding up best were Financials (XLF) with -0.34%.
Bond yields rose with the 10-year adding 1 basis point to end at 2.33%. However, the carnage in High Yield debt continued with HYG gapping down and losing another -0.49%. It’s now honing in on breaking its 200-day M/A, which could be an early indicator that higher interest rates may be on their way. The US dollar (UUP) followed suit (-0.41%) and tumbled to its lowest point since late October.
- ETFs in the Spotlight (updated for 2017)
In case you missed the announcement and description of this section, you can read it here again.
It features 10 broadly diversified and sector ETFs from my HighVolume list as posted every Saturday. Furthermore, they are screened for the lowest MaxDD% number meaning they have been showing better resistance to temporary sell offs than all others over the past year.
The below table simply demonstrates the magnitude with which some of the ETFs are fluctuating in regards to their positions above or below their respective individual trend lines (%M/A). A break below, represented by a negative number, shows weakness, while a break above, represented by a positive percentage, shows strength.
For hundreds of ETF choices, be sure to reference Thursday’s StatSheet.
Year to date, here’s how the 2017 candidates have fared so far:
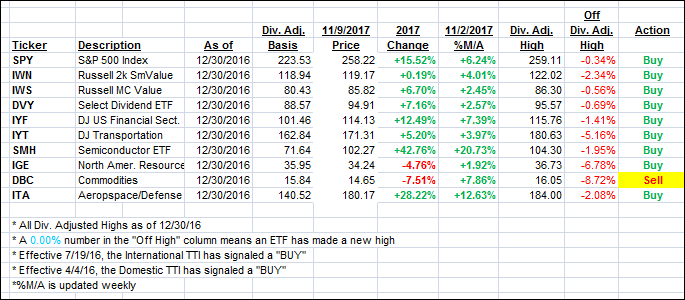
Again, the %M/A column above shows the position of the various ETFs in relation to their respective long term trend lines, while the trailing sell stops are being tracked in the “Off High” column. The “Action” column will signal a “Sell” once the -7.5% point has been taken out in the “Off High” column.
- Trend Tracking Indexes (TTIs)
Our Trend Tracking Indexes (TTIs) slipped as the major indexes were in retreat mode.
Here’s how we closed 11/9/2017:
Domestic TTI: +3.16% (last close +3.35%)—Buy signal effective 4/4/2016
International TTI: +6.14% (last close +6.52%)—Buy signal effective 7/19/2016
Disclosure: I am obliged to inform you that I, as well as my advisory clients, own some of the ETFs listed in the above table. Furthermore, they do not represent a specific investment recommendation for you, they merely show which ETFs from the universe I track are falling within the guidelines specified.
Contact Ulli