
- Moving the markets
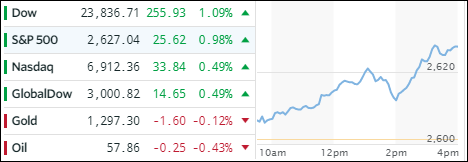
Momentum for equities shifted into overdrive supported by two events. First, Trump’s nominee to run the Federal Reserve, Jerome Powell, testified at a Senate confirmation hearing that “he expects to stay on the course” set by the current Fed chief Yellen. Obviously, these were words that traders wanted to hear and off to the races we went. Second, the Republican tax proposal moved a step closer to a vote in the Senate.
Even geopolitical tensions couldn’t put a damper on the bullish mood and recently recorded records for the indexes were quickly replaced by a new dash into uncharted territory. As a result, green was the favorite color of the day in ETF space. Leading the charge were the Financials (XLF) with +2.60% having its best showing in 8 months. Coming in second and third were Transportations (IYT +1.72%) and US SmallCaps (SCHA +1.44%). Even though the Nasdaq advanced, our winner YTD, namely Semiconductors (SMH), lagged behind with a tiny loss of -0.09%.
The yield on the 10-year bond rose 2 basis points to 2.34%, while the High Yield complex (HYG) calmed down from yesterday’s wild swings and rallied +0.31%. The US Dollar (UUP) showed strength for the second day in a row and added +0.41%. Gold and Oil both slipped immaterially.
- ETFs in the Spotlight (updated for 2017)
In case you missed the announcement and description of this section, you can read it here again.
It features 10 broadly diversified and sector ETFs from my HighVolume list as posted every Saturday. Furthermore, they are screened for the lowest MaxDD% number meaning they have been showing better resistance to temporary sell offs than all others over the past year.
The below table simply demonstrates the magnitude with which some of the ETFs are fluctuating in regards to their positions above or below their respective individual trend lines (%M/A). A break below, represented by a negative number, shows weakness, while a break above, represented by a positive percentage, shows strength.
For hundreds of ETF choices, be sure to reference Thursday’s StatSheet.
Year to date, here’s how the 2017 candidates have fared so far:
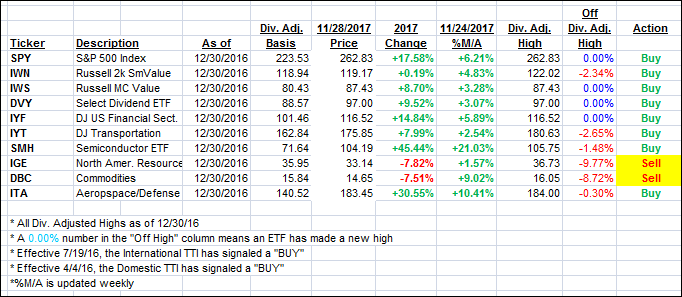
Again, the %M/A column above shows the position of the various ETFs in relation to their respective long term trend lines, while the trailing sell stops are being tracked in the “Off High” column. The “Action” column will signal a “Sell” once the -7.5% point has been taken out in the “Off High” column.
- Trend Tracking Indexes (TTIs)
Our Trend Tracking Indexes (TTIs) slipped a tad as the major indexes were mixed.
Here’s how we closed 11/28/2017:
Domestic TTI: +3.72% above its M/A (last close +3.33%)—Buy signal effective 4/4/2016
International TTI: +6.18% above its M/A (last close +5.84%)—Buy signal effective 7/19/2016
Disclosure: I am obliged to inform you that I, as well as my advisory clients, own some of the ETFs listed in the above table. Furthermore, they do not represent a specific investment recommendation for you, they merely show which ETFs from the universe I track are falling within the guidelines specified.
Contact Ulli