
ETF Tracker StatSheet
https://theetfbully.com/2017/11/weekly-statsheet-etf-tracker-newsletter-updated-11092017/
MORE TAX-CUT DELAY TALK SPOOKS INVESTORS
- Moving the Markets
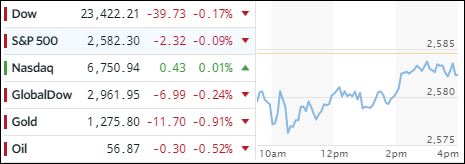
Follow through declines from yesterday’s pullback were rebuffed early on when a slow crawl towards the unchanged line ensued. However, only the Nasdaq was able to muster enough momentum to barely close in the green. The Dow and S&P 500 just fell short thereby registering their first weekly loss in the last nine weeks.
The main worry continued to be the new tax draft bill released by the Senate Finance Committee yesterday, which differed from the House Republican’s plan in that it proposed to delay the cut in corporate taxes until 2019, rather than next year.
Obviously, there will be many discussions coming up before the final vote, but hope has been dwindling that a bill will be passed before Thanksgiving or even Christmas. In other words, Wall Street traders are running out of patience, as the much anticipated economic boost, which has formed the basis of this rally, can’t be counted on in the near future.
In ETF land, the picture was mixed with advancers and decliners just about cancelling each other out. Semiconductors (SMH) picked up the leadership again by adding +0.58%, which was followed by MidCaps (SCHM) with +0.18%. Closing in the red was Aerospace & Defense (ITA) along with Emerging Markets (SCHE) with -0.53% and -0.43% respectively.
Interest rates rose sharply with the yield on the 10-year bond jumping 7 basis points to 2.40%. That was not good news for the 20-year bond (TLT), whose price gapped lower and dove by -1.51%. The US dollar meandered and gave back a tiny -0.08% for the session but lost -0.61% for the week.
- ETFs in the Spotlight (updated for 2017)
In case you missed the announcement and description of this section, you can read it here again.
It features 10 broadly diversified and sector ETFs from my HighVolume list as posted every Saturday. Furthermore, they are screened for the lowest MaxDD% number meaning they have been showing better resistance to temporary sell offs than all others over the past year.
The below table simply demonstrates the magnitude with which some of the ETFs are fluctuating in regards to their positions above or below their respective individual trend lines (%M/A). A break below, represented by a negative number, shows weakness, while a break above, represented by a positive percentage, shows strength.
For hundreds of ETF choices, be sure to reference Thursday’s StatSheet.
Year to date, here’s how the 2017 candidates have fared so far:
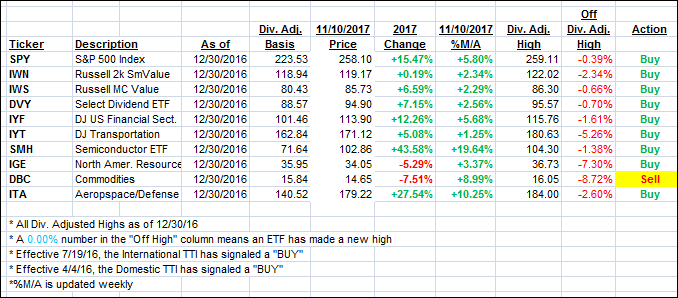
Again, the %M/A column above shows the position of the various ETFs in relation to their respective long term trend lines, while the trailing sell stops are being tracked in the “Off High” column. The “Action” column will signal a “Sell” once the -7.5% point has been taken out in the “Off High” column.
- Trend Tracking Indexes (TTIs)
Our Trend Tracking Indexes (TTIs) headed south as the major indexes showed no clear direction.
Here’s how we closed 11/10/2017:
Domestic TTI: +2.99% (last close +3.16%)—Buy signal effective 4/4/2016
International TTI: +5.66% (last close +6.14%)—Buy signal effective 7/19/2016
Disclosure: I am obliged to inform you that I, as well as my advisory clients, own some of the ETFs listed in the above table. Furthermore, they do not represent a specific investment recommendation for you, they merely show which ETFs from the universe I track are falling within the guidelines specified.
————————————————————-
READER Q & A FOR THE WEEK
All Reader Q & A’s are listed at our web site!
Check it out at:
https://theetfbully.com/questions-answers/
———————————————————-
WOULD YOU LIKE TO HAVE YOUR INVESTMENTS PROFESSIONALLY MANAGED?
Do you have the time to follow our investment plans yourself? If you are a busy professional who would like to have his portfolio managed using our methodology, please contact me directly or get more details at:
https://theetfbully.com/personal-investment-management/
———————————————————
Back issues of the ETF/No Load Fund Tracker are available on the web at:
https://theetfbully.com/newsletter-archives/
Contact Ulli