
- Moving the Markets
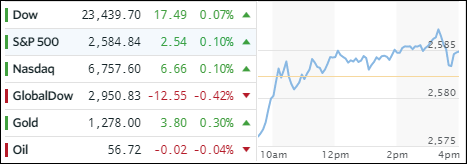
The major indexes dropped into the red right after the opening bell but managed to climb out of the basement fairly quickly only to spend the rest of the session around the unchanged line without much conviction. In the end, we closed in the green but only by the slightest of margins.
Upside momentum never shifted into high gear as worries about more delays in the timing of the corporate tax cuts kept a lid on any meaningful advances. The differences in the House’s and Senate’s versions appear to be so large that a quick resolution appears unlikely—at least as of this very moment.
In ETF space, we saw more winners than losers. On the plus side, Semiconductors (SMH) ruled with a gain of +0.42% with the Dividend ETF (SCHD) following closely behind with an advance of +0.39%. On the negative side, International SmallCaps (SCHF) gave back -0.72% while Aerospace & Defense (ITA) lost -0.51%.
Interest rates were mixed and traded in a tight range with 10-year bond yield remaining unchanged by clinging to the 2.40% level. Even the High Yield ETF (HYG) stopped its free-fall for the moment by only dropping -0.07%. The US dollar (UUP) appeared to be trend-less as well and closed up +0.08%.
- ETFs in the Spotlight (updated for 2017)
In case you missed the announcement and description of this section, you can read it here again.
It features 10 broadly diversified and sector ETFs from my HighVolume list as posted every Saturday. Furthermore, they are screened for the lowest MaxDD% number meaning they have been showing better resistance to temporary sell offs than all others over the past year.
The below table simply demonstrates the magnitude with which some of the ETFs are fluctuating in regards to their positions above or below their respective individual trend lines (%M/A). A break below, represented by a negative number, shows weakness, while a break above, represented by a positive percentage, shows strength.
For hundreds of ETF choices, be sure to reference Thursday’s StatSheet.
Year to date, here’s how the 2017 candidates have fared so far:

Again, the %M/A column above shows the position of the various ETFs in relation to their respective long term trend lines, while the trailing sell stops are being tracked in the “Off High” column. The “Action” column will signal a “Sell” once the -7.5% point has been taken out in the “Off High” column.
- Trend Tracking Indexes (TTIs)
Our Trend Tracking Indexes (TTIs) barely moved with major indexes remaining flat.
Here’s how we closed 11/13/2017:
Domestic TTI: +3.02% (last close +2.99%)—Buy signal effective 4/4/2016
International TTI: +5.45% (last close +5.66%)—Buy signal effective 7/19/2016
Disclosure: I am obliged to inform you that I, as well as my advisory clients, own some of the ETFs listed in the above table. Furthermore, they do not represent a specific investment recommendation for you, they merely show which ETFs from the universe I track are falling within the guidelines specified.
Contact Ulli