
- Moving the Markets
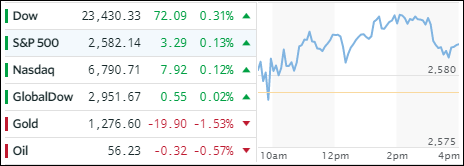
Friday’s strong rebound continued today although at a lesser pace. Nevertheless, the major indexes rose in unison as Wall Street traders kept the prospect for the tax cuts and corporate earnings in focus. Despite political upheaval in Germany, caused by Chancellor Merkel not being able to form a coalition government, equities on both sides of the Atlantic were not affected.
Our ETF portfolios performed better than the major averages thanks to nice advances in Semiconductors (SMH +1.21%), Aerospace & Defense (ITA +0.83%) and US SmallCaps (SCHA +0.61%). The gains were solid across the board with no red numbers in sight.
Interest rates rose with the yield on the 10-year bond adding 2 basis points to end the session at 2.37%. Last week’s volatility in the High Yield sector slowed down with HYG losing a tiny -0.04%. Oil dropped and gold got hammered early on as someone decided to dump a huge amount of futures contracts in an obvious attempt to stop gold from reclaiming its $1,300 level. The drop was almost $20, which caused a break below the 50- and 100-day M/As.
With the Euro plunging, thanks to uncertainty in Germany, the US Dollar (UUP) benefited and rallied +0.49% to stay above its 50-day M/A.
- ETFs in the Spotlight (updated for 2017)
In case you missed the announcement and description of this section, you can read it here again.
It features 10 broadly diversified and sector ETFs from my HighVolume list as posted every Saturday. Furthermore, they are screened for the lowest MaxDD% number meaning they have been showing better resistance to temporary sell offs than all others over the past year.
The below table simply demonstrates the magnitude with which some of the ETFs are fluctuating in regards to their positions above or below their respective individual trend lines (%M/A). A break below, represented by a negative number, shows weakness, while a break above, represented by a positive percentage, shows strength.
For hundreds of ETF choices, be sure to reference Thursday’s StatSheet.
Year to date, here’s how the 2017 candidates have fared so far:
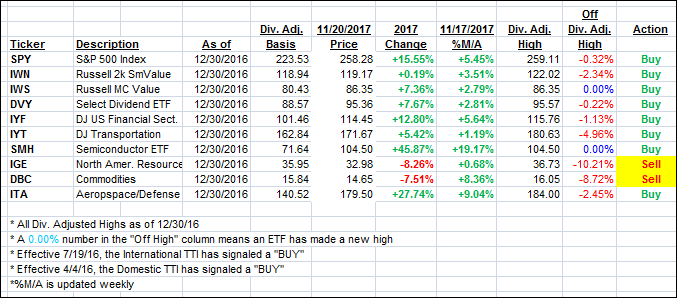
Again, the %M/A column above shows the position of the various ETFs in relation to their respective long term trend lines, while the trailing sell stops are being tracked in the “Off High” column. The “Action” column will signal a “Sell” once the -7.5% point has been taken out in the “Off High” column.
- Trend Tracking Indexes (TTIs)
Our Trend Tracking Indexes (TTIs) showed a mixed picture as the major indexes climbed higher.
Here’s how we closed 11/20/2017:
Domestic TTI: +3.03% above its M/A (last close +2.95%)—Buy signal effective 4/4/2016
International TTI: +5.27% above its M/A (last close +5.31%)—Buy signal effective 7/19/2016
Disclosure: I am obliged to inform you that I, as well as my advisory clients, own some of the ETFs listed in the above table. Furthermore, they do not represent a specific investment recommendation for you, they merely show which ETFs from the universe I track are falling within the guidelines specified.
Contact Ulli