
- Moving the Markets
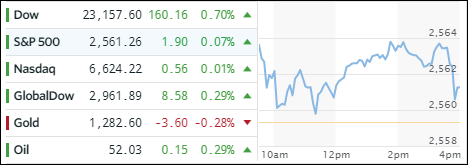
Sometimes you just have to laugh. The Dow rallied sharply by some 160 points with over 100 of them coming from IBM’s jump in stock price of almost 9%, its best in 9 years. You’d think that IBM’s earnings report card set the world on fire, but that was not the case, as they managed to beat expectations for profit and sales despite declining revenues for a 22nd consecutive quarter. Creative accounting allowed the company to have an astonishingly low tax rate of 11%. Go figure…
The S&P 500 and Nasdaq were the laggards and barely managed to crawl above the unchanged line. Consequently, we saw some mixed results in the ETF arena. Transportations (IYT) ranked number 1 with a +0.79% gain followed by SmallCaps (SCHA) with +0.38% and Semiconductors with +0.37%. Surprisingly, we saw no red numbers, although LargeCaps (SCHX) lagged the bunch by adding only +0.11%.
Interest rates rose with the 10-year yield adding 4 basis points to end the session at 2.34%. Gold remained weak, but oil eked out a small gain to conquer the $52 level. The US dollar (UUP) got pumped and dumped intra-day and ended the session lower by -0.12%.
- ETFs in the Spotlight (updated for 2017)
In case you missed the announcement and description of this section, you can read it here again.
It features 10 broadly diversified and sector ETFs from my HighVolume list as posted every Saturday. Furthermore, they are screened for the lowest MaxDD% number meaning they have been showing better resistance to temporary sell offs than all others over the past year.
The below table simply demonstrates the magnitude with which some of the ETFs are fluctuating in regards to their positions above or below their respective individual trend lines (%M/A). A break below, represented by a negative number, shows weakness, while a break above, represented by a positive percentage, shows strength.
For hundreds of ETF choices, be sure to reference Thursday’s StatSheet.
Year to date, here’s how the 2017 candidates have fared so far:
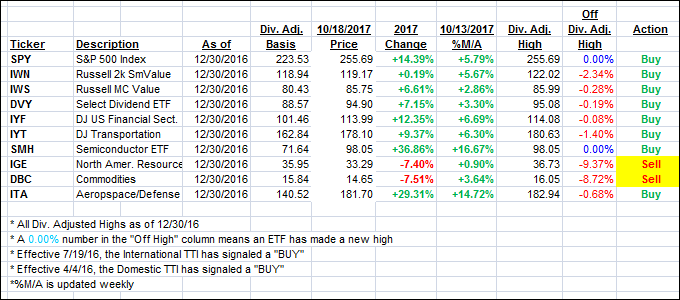
Again, the %M/A column above shows the position of the various ETFs in relation to their respective long term trend lines, while the trailing sell stops are being tracked in the “Off High” column. The “Action” column will signal a “Sell” once the -7.5% point has been taken out in the “Off High” column.
- Trend Tracking Indexes (TTIs)
Our Trend Tracking Indexes (TTIs) moved up fractionally.
Here’s how we closed 10/18/2017:
Domestic TTI: +3.19% (last close +3.15%)—Buy signal effective 4/4/2016
International TTI: +7.03% (last close +6.90%)—Buy signal effective 7/19/2016
Disclosure: I am obliged to inform you that I, as well as my advisory clients, own some of the ETFs listed in the above table. Furthermore, they do not represent a specific investment recommendation for you, they merely show which ETFs from the universe I track are falling within the guidelines specified.
Contact Ulli