
- Moving the Markets
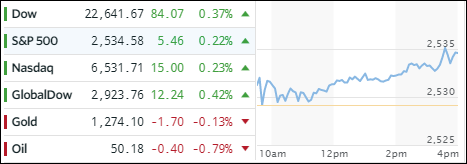
After some early aimless meandering, although above the unchanged line, the major indexes picked up some steam late in the day to book another round of records. The Dow, the Nasdaq, the S&P 500 and the Russell all registered all-time highs.
You can find a lot of reasons for and against a continuation of this rally, but the fact remains that right now the bulls are clearly in charge. Some recent manufacturing data have supported the positive view on stocks along with continued hopes for Trump’s tax cut ideas.
Still, some think that the advance YTD has been overdone. No question about it, but no one has the answer as to when the inevitable turnaround will happen; we’ll simply follow the major trend until it ends and our exit strategy tells us to step aside.
In the ETF arena, we saw nothing but green numbers, at least in those funds we currently own. Emerging markets (SCHE) took the lead with a solid +1.45% gain, followed by Transportations (IYT) with +0.70%. Lagging the bunch were SmallCaps (SCHA) with +0.22% and Aerospace & Defense (ITA) with +0.01%.
Interest rates dropped a tad allowing the 20-year bond (TLT) to bounce off its recently made bottom by gaining +0.10%. Gold was pretty much unchanged and appears to be glued to its 100-day M/A. The US dollar index (UUP) traded within a tight range and ended up dropping an insignificant -0.04%.
- ETFs in the Spotlight (updated for 2017)
In case you missed the announcement and description of this section, you can read it here again.
It features 10 broadly diversified and sector ETFs from my HighVolume list as posted every Saturday. Furthermore, they are screened for the lowest MaxDD% number meaning they have been showing better resistance to temporary sell offs than all others over the past year.
The below table simply demonstrates the magnitude with which some of the ETFs are fluctuating in regards to their positions above or below their respective individual trend lines (%M/A). A break below, represented by a negative number, shows weakness, while a break above, represented by a positive percentage, shows strength.
For hundreds of ETF choices, be sure to reference Thursday’s StatSheet.
Year to date, here’s how the 2017 candidates have fared so far:
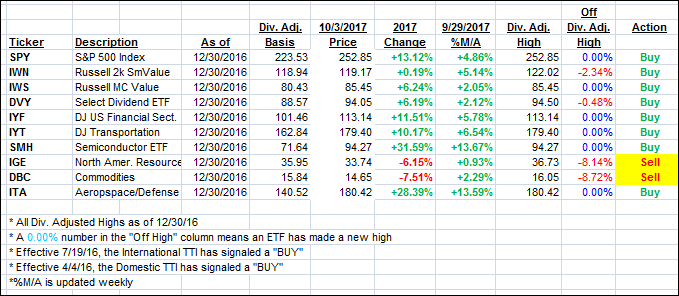
Again, the %M/A column above shows the position of the various ETFs in relation to their respective long term trend lines, while the trailing sell stops are being tracked in the “Off High” column. The “Action” column will signal a “Sell” once the -7.5% point has been taken out in the “Off High” column.
- Trend Tracking Indexes (TTIs)
Our Trend Tracking Indexes (TTIs) continued their upward trajectory.
Here’s how we closed 10/3/2017:
Domestic TTI: +3.03% (last close +2.90%)—Buy signal effective 4/4/2016
International TTI: +7.10% (last close +6.79%)—Buy signal effective 7/19/2016
Disclosure: I am obliged to inform you that I, as well as my advisory clients, own some of the ETFs listed in the above table. Furthermore, they do not represent a specific investment recommendation for you, they merely show which ETFs from the universe I track are falling within the guidelines specified.
Contact Ulli